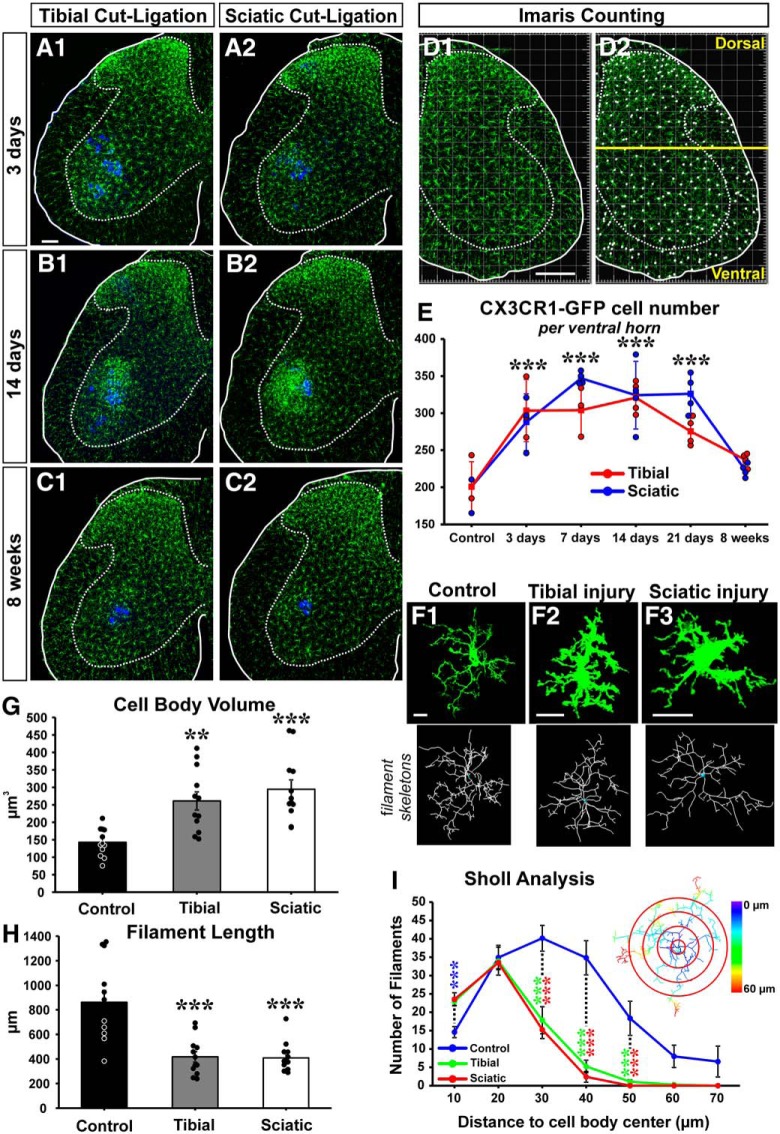
Figure 3.
Microglia activation around injured MNs. A–C, CX3CR1-GFP microglia (green) 3 d (A), 14 d (B), and 8 weeks (C) after tibial (A1, B1, C1) or sciatic (A2, B2, C2) cut ligation. LG MNs are labeled with Fast Blue (blue). D, Quantification of GFP+ microglia using unbiased automatic Imaris spot function. D1, GFP fluorescence. D2, Cell body identification. A line traced above the dorsal tip of the central canal separates dorsal from ventral regions. E, Number of CX3CR1-GFP microglia per ventral horn in 50-μm-thick sections at different times after injury after a sciatic (blue line) or a tibial (red line) nerve injury. There is a significant increase in the number of GFP+ microglia after both tibial and sciatic ligation from 3 to 21 d after injury: ***p < 0.001, all versus control after either injury. Microglia numbers return to baseline by 8 weeks after injury. No statistical differences were detected between sciatic and tibial nerve injury in GFP+ microglial cell numbers. Each dot represents 1 animal. Lines indicate mean ± SE at each time point (n = 4 mice; 6 ventral horns were counted per mouse). F, High-magnification 2D projections of single CX3CR1-GFP microglia in control and 14 d after a tibial or sciatic nerve injury. Bottom, Imaris filament tracker reconstructions used for quantification. G, Microglia cell body volume significantly increased compared with control after both nerve injuries: **p < 0.01; ***p < 0.001. H, Total microglia process length shows significant decreases compared with controls: ***p < 0.001. G, H, Each data point represents an individual microglia cell (n = 12 in each group). Error bars indicate SE. I, Sholl analysis compares the total number of microglia filaments in increasing 10 μm distance bins from the cell body center. Control microglia have significantly fewer processes in the first 10 μm than microglia in the injured conditions (blue asterisks); but past 20 μm, there are significantly fewer microglia processes in injured animals. Asterisks represent significant differences compared with control (blue) after sciatic (red) or tibial (green) nerve injury: ***p < 0.001. Inset, Sholl analysis bins with color-coded distances. Scale bars: A, D1, 100 μm; F, 10 μm.

