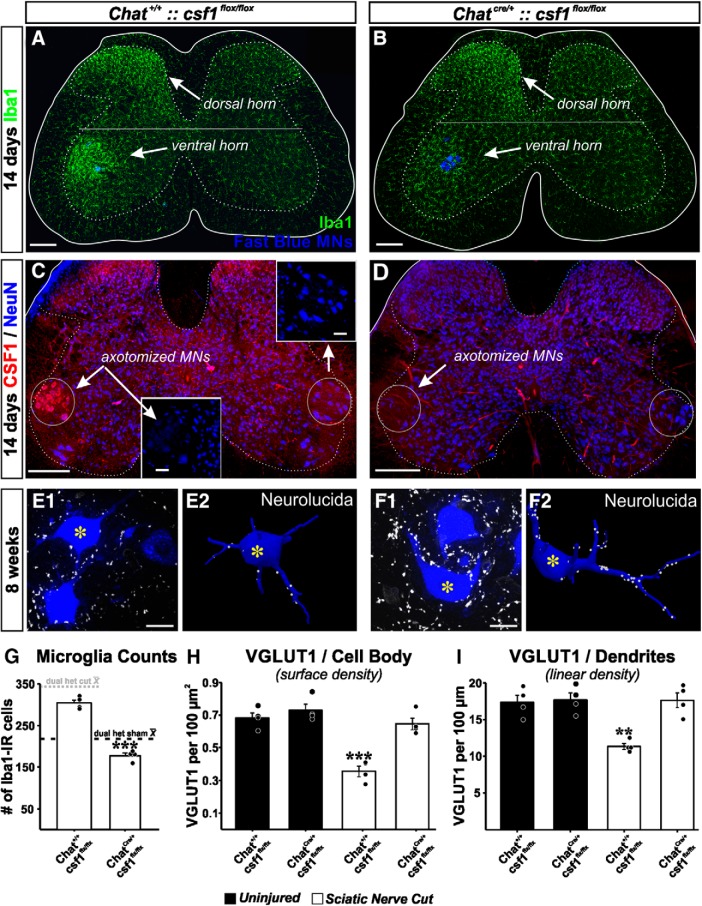
Figure 4.
VGLUT1 synapses are rescued by genetic attenuation of microglia responses in the ventral horn after deleting CSF1 from MNs. A, B, Microglia activation in the dorsal and ventral horn 14 d after sciatic nerve transection and repair in animals in which csf1 is genetically deleted from MNs (B) or not (A). Ventral horn microglia response is significantly attenuated after removing csf1 from MNs. C, D, Confirmation of CSF1 deletion. CSF1 is upregulated in axotomized MNs after nerve injury, but CSF1 is not present following csf1 deletion in Chat-expressing neurons. Section counterstained with NeuN. NeuN is downregulated in axotomized MNs (Alvarez et al., 2011). E, F, VGLUT1 synapses on Fast Blue LG MNs with csf1 preserved (E) or removed (F). Images represent a single confocal plane (left) and the 3D Neurolucida reconstructions (right). Reconstructions correspond to MNs with an asterisk. G, Quantification of microglia numbers 14 days post injury in the ventral horn of animals with csf1 removed from MNs (ChatCre/+::csf1 flox/flox) and genetic controls (Chat+/+::csf1flox/flox). Dashed lines indicate the average number of ventral horn microglia per section in dual-heterozygote Cx3cr1GFP/+::Ccr2RFP/+ animals in sham controls (dark dashed line) or after sciatic nerve transection and ligation (dashed dotted line). Removal of csf1 from MNs prevents the increase in microglia numbers after nerve injury. ***p < 0.001, between animals with csf1 removed or preserved (t tests). H, I, VGLUT1 densities on the cell body (surface densities, H) and on the dendrites (linear density, I) eight weeks after injury in injured animals (white bars) with csf1 removed or not compared with uninjured animals of the same genotypes. MNs with csf1 preserved display the excepted reductions in VGLUT1 densities. After removal of csf1, MNs display densities similar to uninjured, suggesting rescue. Moreover, removal of csf1 from Chat-expressing neurons did not affect VGLUT1 densities (these are similar to uninjured WTs and sham controls in Fig. 2). Error bars in all histograms indicate SE. Each dot represents 1 animal n = 4 animals per bar. For microglia numbers, each animal value is the average of 6 ventral horns. For estimating VGLUT1 densities, each animal's estimate results from averaging 6 reconstructed MNs. H, ***p < 0.001, compared with all other groups (post hoc Bonferroni t tests). I, **p < 0.01, compared with all other groups (post hoc Bonferroni t tests). Scale bars: A–D, 200 μm; C, Inset, 50 μm; E1, F1, 20 μm.

