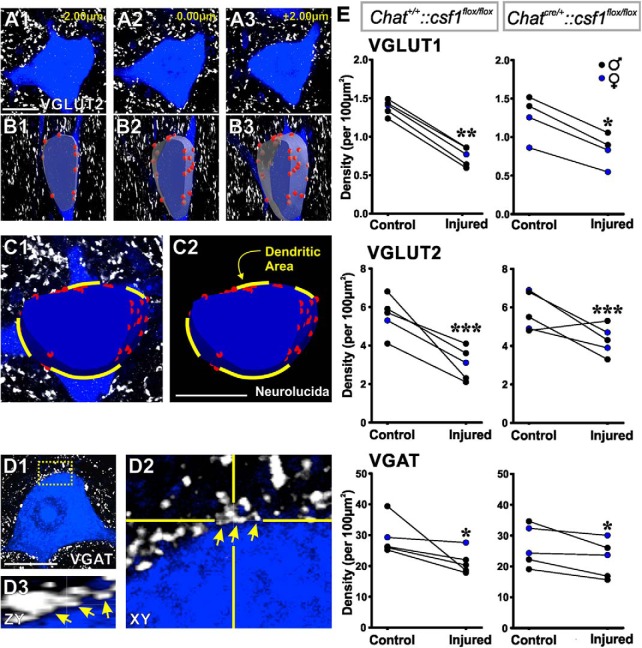
Figure 5.
“Synaptic stripping” is independent of microglia activation. A–C, Method for assessing synaptic densities on MN cell bodies. A, Three representative confocal optical sections separated by 2 μm z distance through the midplane of a Fast Blue MN. White represents VGLUT2-immunoreactive puncta. B, A slab of mid-cell body region reconstructed from 15 such optical sections (7 μm wide; z step: 0.5 μm) and VGLUT2 contacts marked on its surface (red circles). C, A similar reconstruction on a different MN marking exits of dendrites on the reconstructed surface. These areas were subtracted from the total surface of the neuronal slab to estimate the density only on the membrane surface available for synapses on the cell body. D1, VGAT contacts (white) on the cell surface; single optical plane confocal image. D2, D3, High-magnification and rotation showing a cluster of closely spaced VGAT contacts. Each was counted separately but likely represents independent vesicular accumulations in a single terminal and related to the multiplicity of active zones that inhibitory synapses form over cell bodies of MNs. E, Quantification of vesicular marker contact densities comparing MNs in the side ipsilateral (injured MNs) or contralateral (control MNs) to the injury in animals with normal microglia activation (Chat+/+::csf1flox/flox) or blunted microglia activation (ChatCre/+::csf1 flox/flox) (n = 5 animals per genotype; 3–10 MNs analyzed per genotype and side; all MNs were pooled together in a single average per animal, genotype, and side). VGLUT1 and VGLUT2 synapses were both significantly depleted after injury independent of genotype (p < 0.001). VGAT synapses were also depleted with microglia activation preserved or blunted, but depletions were lower compared with VGLUTs, but still significant (p < 0.05). There was more interanimal variability in VGAT depletions, and this was identified as originating in sex differences (in all graphs, blue represents female data points). All replace for comparisons, plural were paired t tests between control and injured side. Scale bars, 20 μm. *p < 0.05; **p < 0.01; ***p < 0.001.

