Figure 8.
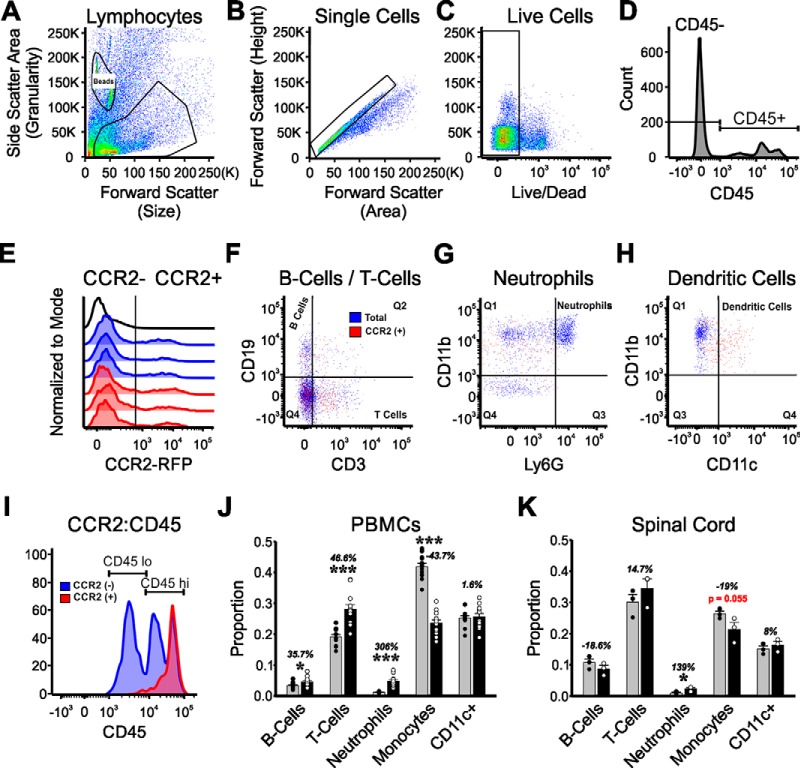
Flow cytometry analysis of CCR2+ cells inside the spinal cord and in the blood in CCR2 hets and CCR2 KOs 21 d after bilateral sciatic nerve injuries. A–C, Gating for cells (A), single cells (B), and live cells (C) from spinal cord Percoll isolates. D, Resulting cells were gated for CD45 and (E) CCR2. F, All CD45 or CD45+ CCR2+ cells were gated on CD19 (B cells) versus CD3 (T cells). G, The CD3− CD19− population was then gated on Ly6G versus CD11b to identify neutrophiles (Ly6G+ CD11b+). H, CD11b+ Ly6G− cells were on CD11b versus CD11c to identify dendritic cells. I, CD45 cells were analyzed for low or high expression to identify populations of microglia (CD45lo) and activated microglia and macrophages (CD45hi). Only CD45hi CD11b cells express CCR2, suggesting that they have trafficked from the periphery. The results show all cell types represented in the spinal cord, but some lack CCR2. CCR2+ subtypes include CD3 T cells, CD11b monocytes/macrophages, and CD11c+ CD11b+ dendritic cells. J, Different cell types in the blood of injured CCR2 heterozygous animal (gray bars) and CCR2 KOs (black bars). Each data point represents a different animal (n = 12 animals). ***p < 0.001 (t tests). The data show the expected reduced numbers of monocyte/macrophages and increased numbers of neutrophils in the blood of CCR2 KOs. K, Percentages of CCR2+ cell populations in spinal cord 21 d after sciatic nerve injuries in CCR2 heterozygous (gray bars) and CCR2 KO animals (black bars). Each data point represents pooling together 4 animals to increase CCR2 cell yield inside the spinal cord (n = 12 animals total, n = 3). *p < 0.05 (t tests). Error bars indicate SE. The results show a depletion of monocyte/macrophages with p = 0.055.

