Figure 5.
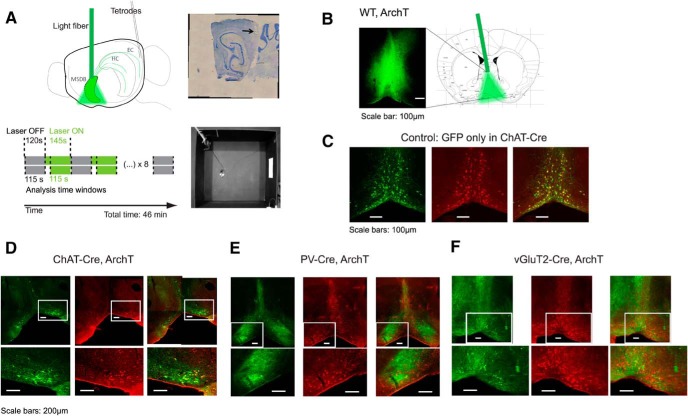
Optogenetic silencing of MSDB neurons in combination with single-unit recordings in the MEC. A, Schematic of laser stimulation in MSDB and single-unit recordings in MEC of the left hemisphere (top left). Positional data and single-unit recordings are acquired while the mouse is freely moving in a 1 m2 open-field environment (bottom right). Baseline (Laser OFF; gray) periods (120 s) are alternating with laser stimulation (Laser ON; green) periods (145 s); see Materials and Methods for details of laser stimulation. A typical recording session lasts 46 min. Only the last 115 s of each baseline or laser stimulation period are analyzed in account of slow time scales of muscarinic receptor-mediated effects. Tetrode positions are confirmed by post hoc electro-lesions and cresyl-violet staining (top right). B, Unconditional ArchT-GFP expression (ArchT) in the MSDB of one example mouse, and schema of light fiber placement to deliver light into the MSDB. Scale bar, 100 μm. Schematic adapted from Paxinos and Franklin (2008). C–E, Immunofluorescence data showing expression of GFP or ArchT-GFP (FITC; green signal, left), and ChAT (Cy3; red signal, middle), and merged signals (right). C, Example data showing cell-type-specific expression of GFP in cholinergic neurons of the MSDB of a ChAT-Cre mouse. Scale bars, 100 μm. D, Example data showing cell-type-specific expression of ArchT-GFP in cholinergic MSDB neurons of a ChAT-Cre mouse. Scale bars, 200 μm. E, Example data showing no overlap of GFP and Cy3 signals in PV-Cre mice, indicating ArchT is conditionally expressed in GABAergic MSDB neurons after viral transduction of PV-Cre mice. Scale bars, 200 μm. F, Example data showing no overlap of GFP and Cy3 signals in vGluT2-Cre mice, indicating ArchT is conditionally expressed in glutamatergic MSDB neurons after viral transduction of vGluT2-Cre mice. Scale bars, 200 μm.

