Figure 7.
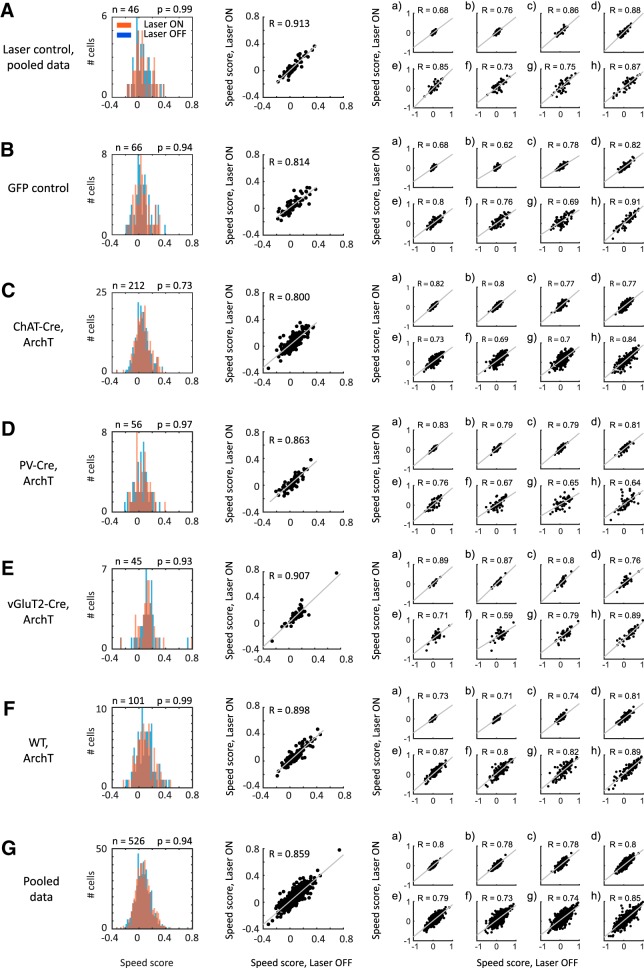
Firing-rate speed tuning does not depend on medial septum inputs. Speed scores of speed-modulated neurons in the MEC do not differ significantly during baseline and optogenetic silencing of MSDB neurons at each time scale tested. First column, Histogram plots showing the distribution of overall speed scores during baseline (Laser OFF; blue) and laser stimulation (Laser ON; red) periods. No significant differences exist on the population level, p values of KS test shown in the figure. Second column, Scatter plots showing the speed scores during baseline (Laser OFF) and laser stimulation (Laser ON) periods for all cells, significant correlations (p < 0.0001) observed for all groups, Pearson correlation coefficient (R) shown in the figure. Third column, Scatter plots of speed scores during baseline (Laser OFF) and laser stimulation (Laser ON) periods for different time scales, (a) 1–2 s, (b) 2–4 s, (c) 4–8 s, (d) 8–16 s, (e) 16–32 s, (f) 32–64 s, (g) 64–128 s, (h) 128–256 s, and (i) 256–512 s. Pearson correlation coefficients (R) for each time scale shown in figure. A, Laser control data from sessions where the laser light was prevented from entering the brain tissue. Data from n = 46 cells from seven mice. B, Control data from mice in which only GFP was expressed in ChAT-Cre neurons, n = 66 cells from three mice. C, Data from ChAT-Cre mice expressing ArchT in cholinergic MSDB neurons, n = 212 cells from nine mice. D, Data from PV-Cre mice expressing ArchT in GABAergic MSDB neurons, n = 56 cells from four mice. E, Data from vGluT2-Cre mice expressing ArchT in glutamatergic MSDB neurons, n = 45 cells from two mice. F, Data from wild-type mice unconditionally expressing ArchT in MSDB neurons, n = 101 cells from two mice. G, All cells from all groups pooled together, n = 526 cells from 21 mice. This is the dataset used for the further investigation of time scale-dependent speed coding.

