Figure 8.
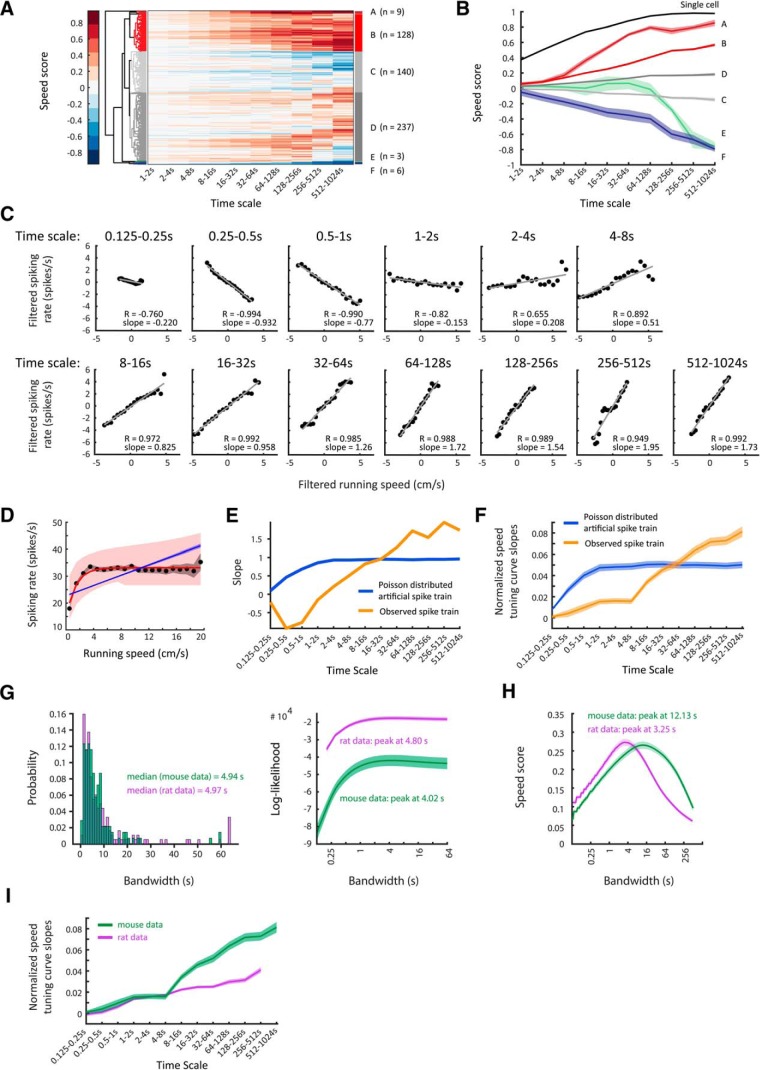
Validation of data on time scale-dependent speed tuning curves in mice. A, Clustergram showing hierarchical clustering of 526 neurons recorded in layer II/III of entorhinal cortex of 21 mice. Each row depicts color-coded speed scores calculated for each time scale ranging from 1 to 2 s up to 512–1024 s (see Materials and Methods). As in the rat dataset, distinct clusters of speed-modulated neurons can be identified. B, Mean ± SEM of time scale-dependent speed scores averaged across units of single clusters. A single most positively speed-modulated cell together with cells of Clusters A and B were defined as positively speed-modulated neurons (138 of 526 cells, 26.2%). Cluster F contains clear negatively speed-modulated neurons (6 of 526 cells, 1.1%). C–F, Data on one speed-modulated example cell in Cluster A. C, Time scale-dependent speed tuning curves of the example cell. Black dots show binned data (time-scale filtered firing rate vs time-scale filtered running speed), red lines show the least-square linear fits to binned data; r = Pearson correlation coefficient. D, The overall speed tuning curve of the example cell. Black dots and gray shading show mean values and 95% confidence intervals of speed-binned firing-rate data; blue and red lines show the best MLE linear (blue) and saturating exponential (red) fit functions obtained by temporal binning of firing rate, shadings indicate 95% confidence intervals. E, Slopes of observed time scale-dependent speed tuning curves (orange curve) compared with mean ± SEM of slopes derived from 100 artificially created linearly tuned Poisson-distributed spike trains (blue line; SEM within line). F, Mean ± SEM of mean-normalized speed tuning curve slopes (orange: positively speed-modulated cells of the single most positively speed-modulated cell, Clusters A, and Cluster B; blue: artificially created Poisson-distributed spike trains, one Poisson train per cell, n = 138). Observed spike trains differ significantly from artificial ones: F(12,3562) = 26.25, p = 1.6 × 10−57, two-way ANOVA interaction effect. G–I, Mouse data (green) are shown compared with rat data (purple). G, Left, Distribution of optimal bandwidths for firing-rate estimation. Right, Population average (mean ± SEM) of bandwidth-dependent log-likelihoods of firing-rate estimates. H, Population average (mean ± SEM) of bandwidth-dependent speed-score distributions. I, Mean ± SEM of mean-normalized speed tuning curve slopes.

