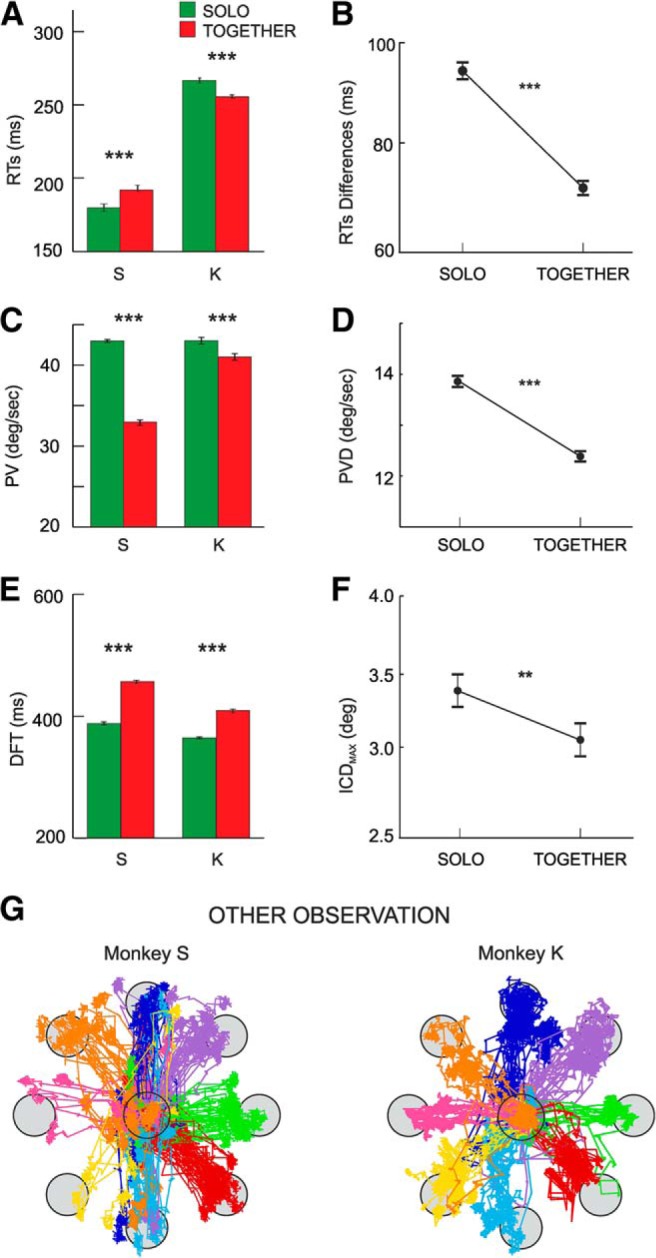
Figure 2.

Behavioral data measured during SOLO (green) and TOGETHER (red) trials averaged across sessions. A, Mean RTs of Monkeys S and K across task conditions. B, Mean differences between RTs of Monkeys S and K in SOLO and TOGETHER trials. C, Mean values of cursor peak velocities (PV across task conditions.). D, Mean differences between peak velocities (PVD) of the two animals in SOLO and TOGETHER trials. E, Mean duration of DFT. F, Mean values of the maximum inter-cursor distance (ICDMAX) between the stimuli, controlled by Monkeys S and K in the SOLO and TOGETHER conditions across trials. In A–F, error bars represent the SE, and asterisks indicate significant differences (t-test; **p < .01; ***p < .001). G, Examples of eye trajectories recorded during the OBS-OTHER condition of one monkey, during which its partner was performing the SOLO trials. For each monkey, data refers to pooled trials collected in two typical recording sessions.
