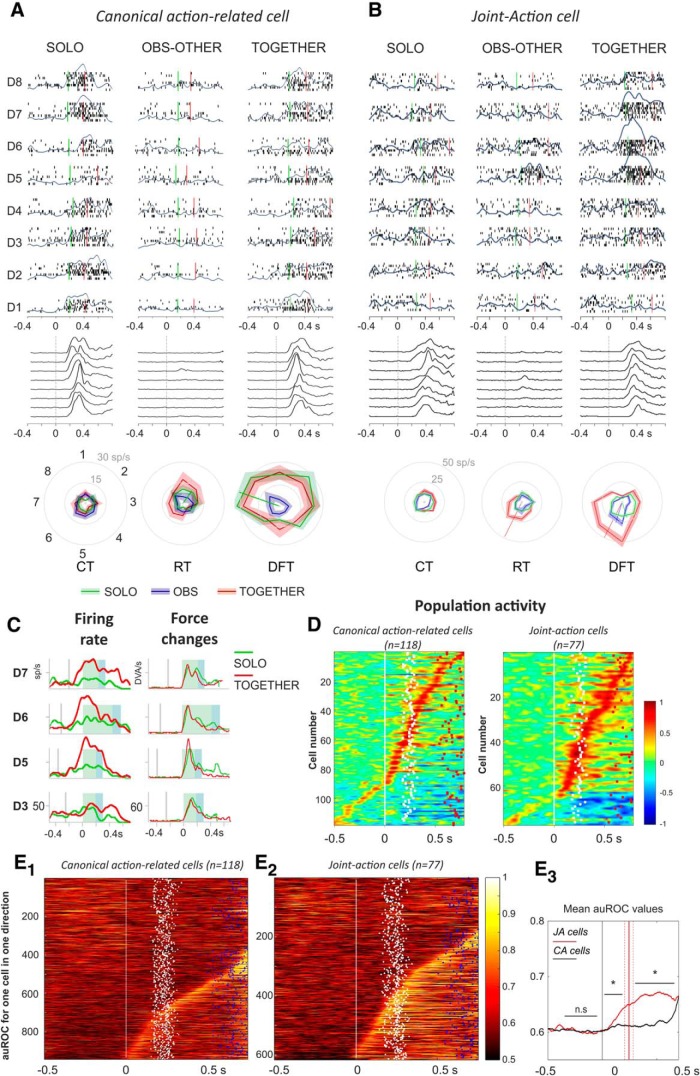
Figure 4.
Neural activity of joint-action and canonical action-related cells. A, Neural activity of a canonical action-related neuron in form of rastergrams (5 replications) and SDFs (overimposed gray curves) in 3 task conditions (SOLO, OBS-OTHER, TOGETHER) and 8 directions (D1–D8), aligned to the target presentation (0 s). The corresponding behavior is shown below each condition by representing the changes of force application (black curves). Cell activity was modulated during DFT, both when the monkey acted individually (SOLO; two-way ANOVA; p < 0.05) and jointly with the partner in the TOGETHER condition (two-way ANOVA, p < 0.05) and it was not significantly different across task conditions (DFT; SOLO vs TOGETHER; two-way ANOVA, p > 0.05). The cell was silent both during the OBS-OTHER and EYE tasks (data not shown; two-way ANOVA, p > 0.05). Polar plots (bottom) show that the cell was directionally tuned during DFT and its preferred direction (PD) did not change from SOLO to TOGETHER condition. B, Neural activity of a joint-action cell, modulated during DFT, both when the monkey performed the action individually (SOLO; two-way ANOVA; p < 0.05) and, in a much stronger fashion, during joint-action with the partner (TOGETHER condition; two-way ANOVA, p < 0.05). The cell was poorly modulated (two-way ANOVA, p < 0.05) in the OBS-OTHER and silent in the EYE condition (data not shown; two-way ANOVA, p > 0.05). Conventions and symbols as in A. C, Direct comparison of the SDFs (left) of the joint-action cell shown in B, observed during the SOLO (green) and TOGETHER (red) task, in directions D3, D5, D6, and D7. Data are aligned to DFT (green shading) onset, followed by THT (blue shading). The corresponding force changes are shown on the right (thin curves). D, SDFs for the population of canonical action-related and joint-action cells (each row corresponding to 1 cell), aligned to the target presentation (0 s, white line). Dots indicate onset (white) and end (red) of DFT. Color bar, Normalized activation relative to CT. E, ROC plots for canonical action-related (E1) and joint-action (E2) cells, evaluating the discrimination between action conditions (SOLO vs TOGETHER). Colors show the auROC values of each individual cell, rank-ordered according to the time at which after target presentation auROC values exceeded the mean plus two times the SD, of the auROC measured during the CT. In each graph, time of alignment (0 ms; white line) corresponds to the target presentation; dots indicate times of start of force application (white) and times of cursor arrival on peripheral target (blue). Color bar, auROC values ranging from 0.5 (no discrimination) to 1 (high discrimination). E3, Comparison of mean auROC values across cells of the two subpopulations [canonical action-related (CA), black; joint-action (JA), red] and across directions (Wilcoxon rank sum test, *p < 0.05).

