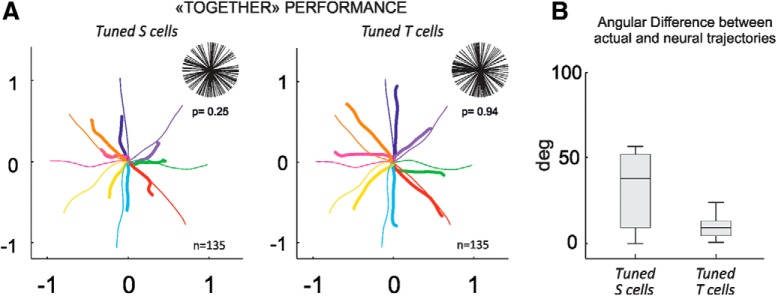
Figure 5.
Neural representation of joint-action through population vector analysis. A, Decoded (thick colored) and actual (thin colored) cursor's motion trajectories reconstructed from directionally tuned S and tuned T cells, after combining the activity of the two interacting brains. For each subpopulation, in the top-right corner the distribution of preferred directions is plotted with relative statistics on the uniformity of the distributions (Rayleigh's test). B, Boxplot of the angular differences between vectors defining the decoded and actual trajectories at each time t, computed for two different sets of cells.

