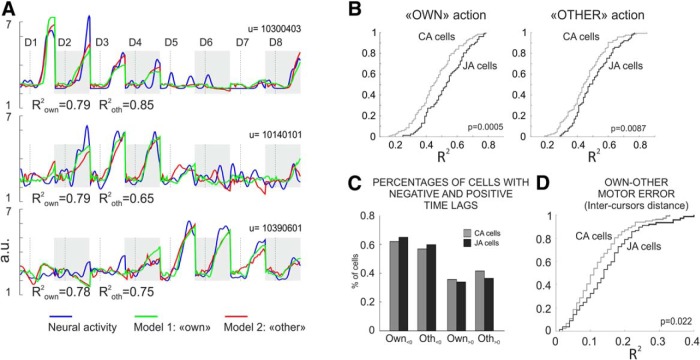
Figure 6.
Neural representation of the own and of the other performance during joint-action. A, Example of neural representation of the own and of the other cursor kinematics, for three premotor cells. For each unit (U), the three curves represent neural activity in the form of SDF (blue), the activity obtained from Model 1 (own cursor; green) and from Model 2 (other cursor, red). The SDF has been over imposed on the two other curves at 0 lag, after appropriate time shifting, by using the ΔT that yielded the best R2 in the MLR. The activities refer to the TOGETHER trials in the eight directions (D1–D8) placed tip-to-tail (highlighted by alternating gray shading), for a time interval spanning from 150 ms before to 300 ms after DFT onset (vertical dashed line). B, Cumulative frequency distributions of correlation coefficients relative to the output kinematics (cursor's motion) of the own (left) and the other (right) action computed for the joint-action (JA; black) and canonical action-related cells (CA; gray). C, Percentages of cells with negative and positive time lags for Model 1 (Own) and Model 2 (Other). D, Representation of the Own-Other motor error (inter-cursor distance) by JA and CA neurons. Cumulative frequency distributions of correlation coefficients obtained by modeling the neural activity of the CA (gray) and JA (black) neurons, with the inter-cursor distance. B, D, The p values refer to Wilcoxon rank sum statistics.

