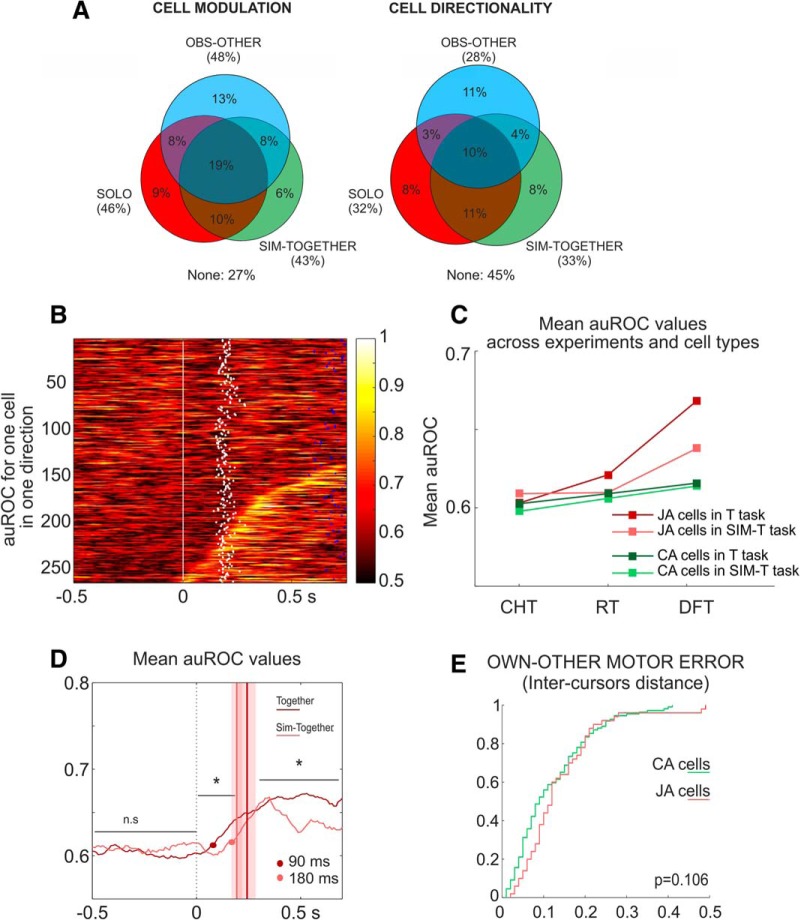
Figure 8.
Neural activity in the simulated joint-action. A, Proportion of cells modulated and directionally tuned in the DFT epoch of three different tasks (SOLO, OBS-OTHER, SIM-TOGETHER). Percentages are calculated with respect to a total of N = 257 cells recorded in the simulated joint-action experiment, where each monkey had to control its own cursor in coordination with a computer-guided moving cursor. B, ROC plots for joint-action cells (JA) recorded during the simulated sessions. Conventions and symbols as in Figure 4E. C, Comparison of mean auROC values evaluated for two sets of cells (CA and JA), in the experimental conditions TOGETHER (T), SIM-TOGETHER (SIM-T) and in three epochs of interest (CT, RT, DFT). For statistics, see Results. D, Comparison of mean auROC values of joint-action cells across experimental conditions (SIM-TOGETHER, pink; TOGETHER, red), aligned to target presentation (0 ms). Vertical lines and shaded area indicate mean DFT onset ±SD for SIM-TOGETHER (gray) and TOGETHER (red) conditions. Red and gray dots indicate the times at which mean auROC values exceeded after target presentation the mean +2 SD, of the auROC measured during the CT. *p < 0.05 Wilcoxon rank sum test. E, Cumulative frequency distributions of correlation coefficients obtained by modeling the neural activity, recorded in the SIM-TOGETHER experiment, with the inter-cursor distance. No significant differences (Wilcoxon rank sum test) were found when comparing the distribution of R2 obtained for CA (green) and JA (pink) neurons.

