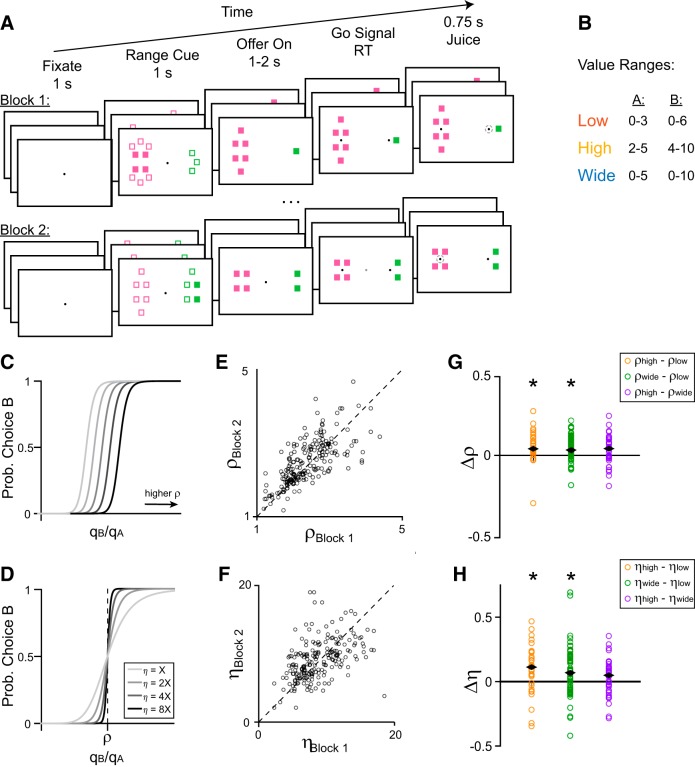
Figure 1.
Task outline and behavioral results. A, Schematic of a session. The monkey chose between two juices, each associated with one color. The animal initiates each trial by fixating on a central point. After 1 s, range cues appear on either side of the central fixation. Filled squares indicate the minimum possible offer for a given juice and total squares indicate the maximum. In this trial, the cue informed the monkey that the quantity of Juice B offered would be between 4 and 10 drops, whereas the quantity of Juice A would be between 0 and 3 drops. After 1 s, the cues are replaced by two sets of filled squares representing the current offers. In this trial, the animal chose between 1 drop of grape juice and 4 drops of fruit punch. After a variable interval (1–2 s), the central fixation disappears, and targets appear next to each offer, cuing the monkey to indicate its choice. The monkey then makes a saccade to one of the targets and holds fixation for 0.75 s, after which it receives the chosen juice. Each session consists of 2–3 blocks, each with ∼250 trials. Ranges remain constant across trials within each block and change between blocks. B, Each juice is offered in one of three ranges: low, high, or wide. The two juices can be offered in either the same type of range or different types of range within a block. C–H, Changes in choice behavior across sessions. C, D, Illustration of the behavioral response function for changing values of relative value ρ (C), or behavioral steepness η (D). Increased ρ corresponds to a decreased probability of choosing offer B for a given offer (qB:qA). Increased η corresponds to less variable choice behavior. E–H, Animal behavior across sessions. Each point represents the behavior from one pair of blocks in a session (n = 205). E, Relative value in the earlier versus later block of a session. Values of ρ were strongly correlated across pairs of blocks in a session (r = 0.73, p = 5.5 × 10⁻³⁵, Pearson correlation) and slightly elevated in later blocks (median Δρ = 0.07; p = 0.011, W = 8.4 × 10⁴). F, Values of η were correlated across blocks (r = 0.24, p = 4.4 × 10⁻⁴, Pearson correlation) but did not differ between the first and second blocks of a session (p = 0.48, W = 1.1 × 10⁴). G, Fractional difference in ρ across range types. The fractional difference is defined as the difference in parameter values divided by their sum. Median differences: ρhigh − ρlow = 0.040 (p = 2.3 × 10⁻⁴, W = 436), ρwide − ρlow = 0.032 (p = 8.3 × 10⁻⁵, W = 1.5 × 10³), ρhigh−ρwide = 0.041 (p = 0.054, W = 479). H, Fractional difference in η across range types. Median differences: ηhigh − ηlow = 0.11 (p = 7.7 × 10⁻³, W = 384), ηwide − ηlow = 0.069 (p = 4.2 × 10⁻³, W = 1.4 × 10³), ηhigh − ηwide = 0.049 (p = 0.14, W = 449). Black diamonds indicate median fractional differences, and asterisks indicate significant difference from 0 (p < 0.05). All p values, Wilcoxon signed rank test.

