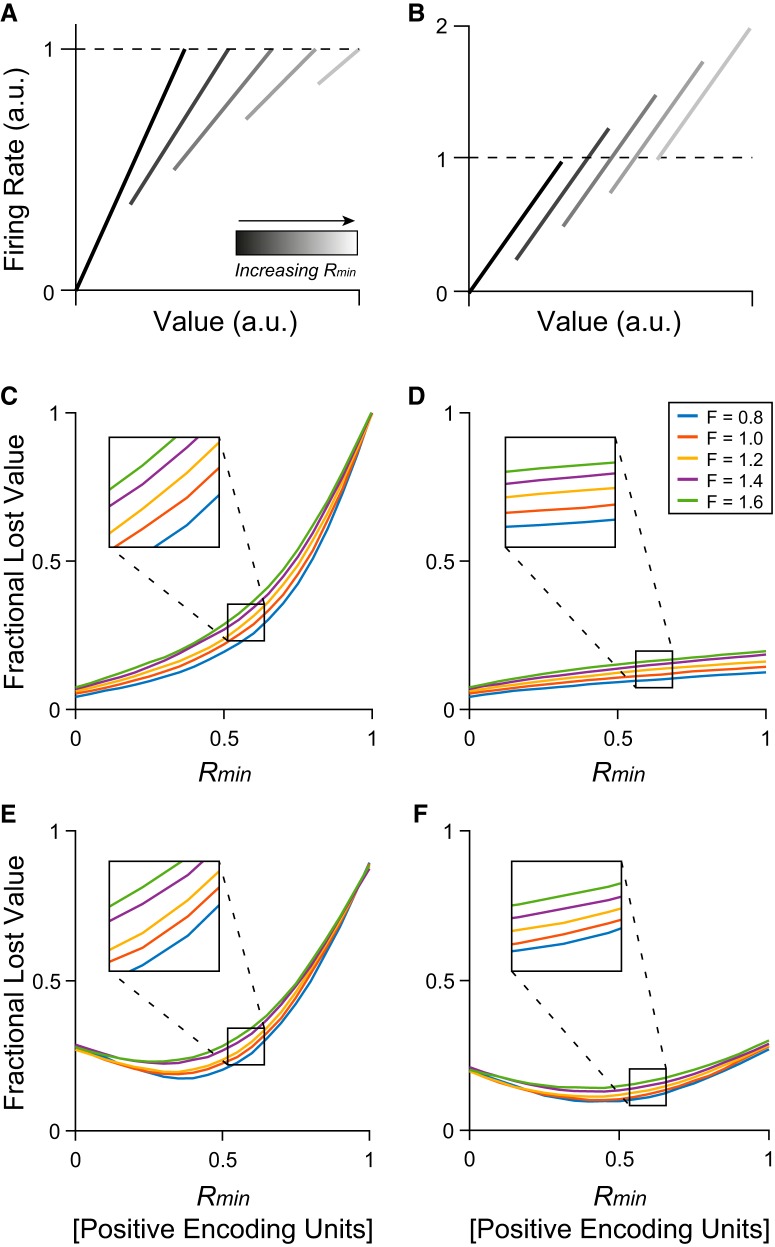
Figure 10.
Choice simulation. FLV increases with increasing R-min. A, B, Illustration of example response functions. A, Rmin increases while Rmax remains fixed. Analogous to a scenario where units adapt only to the maximum value and the value range shifts higher. B, Rmin increases while the value range (Rmax − Rmin) remains fixed. Analogous to the activity offset associated with partial range adaptation in OFC responses. C, D, Simulation results for networks with 100% positive encoding units. C, For neurons with a fixed maximum value, FLV increases to 1 (chance level) as Rmin increases. D, For neurons with a fixed range, FLV increases mildly as Rmin increases. Trace colors indicate results simulated for different Fano factors. Each curve covers 100 values of Rmin and shows the mean of 20 simulated sessions for each value of Rmin. E, F, Simulation results for networks with 30% negative encoding units. The x-axes represent the values of Rmin for units with positive encoding. The minimum response for negative encoding units is evoked by the maximum value (Rmax) in each context and changes in the opposite direction: Rmax[negative] = 1 − Rmin[positive]. E, For units with a fixed maximum response, FLV decreases slightly as Rmin[positive] increases to ∼0.4, then increases rapidly to ∼0.9. F, For units with a fixed activity range, FLV follows a shallow U-shaped function as Rmin[positive] → 1.

