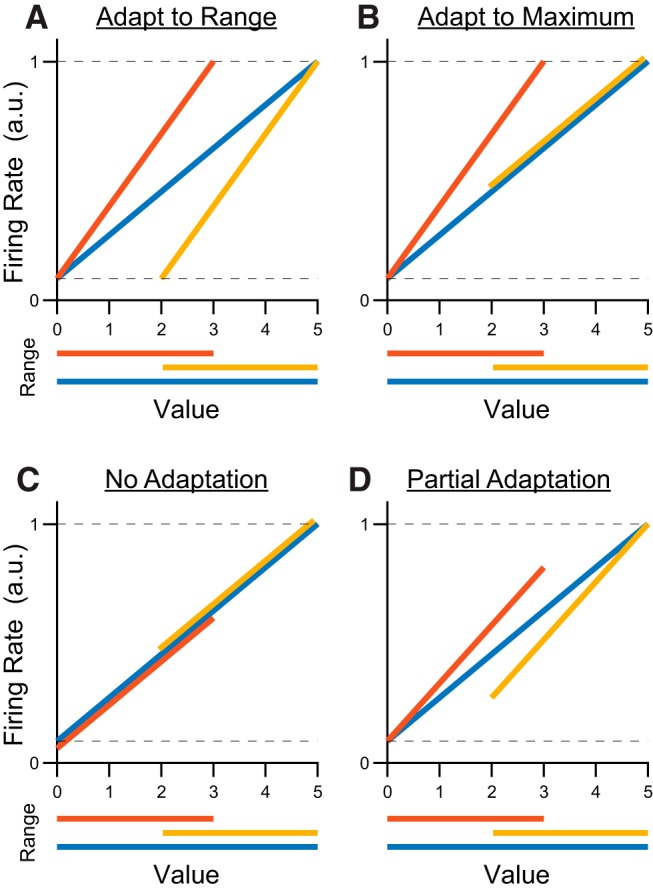
Figure 2.

Four hypotheses for neuronal adaptation in a hypothetical offer value A response. Red, yellow and blue traces represent neural responses in the low, high, and wide range conditions. Dotted lines represent the absolute minimum and maximum responses observed for the neuron across all conditions. Firing rates are shown in arbitrary units. A, Predicted responses if neurons fully adapt to both maximum and minimum values. The slope of encoding is lower in the wide range (blue) compared with the low range (red) or the high range (yellow). The responses to the minimum and maximum values are consistent across all ranges. B, Predicted responses if neurons adapt to changes in maximum but not minimum value. Encoding is steeper in the low range compared with the high or the wide range. The maximum response is consistent across conditions, but the minimum observed response is higher when the minimum value is larger (high range). C, Predicted response if neurons do not adapt at all. The response function does not change across conditions. Neurons have the same encoding slope across all ranges. The maximum (minimum) response is higher in blocks where the maximum (minimum) value is larger. D, Predicted responses if neurons partially adapt to changes in both maximum value and minimum value. Encoding is steeper in the low and high ranges compared with the wide, but the full dynamic range is not always used. The maximum observed response is lower when the maximum value is smaller (low range). Similarly, the response to the minimum value is higher when the minimum value is larger (high range).
