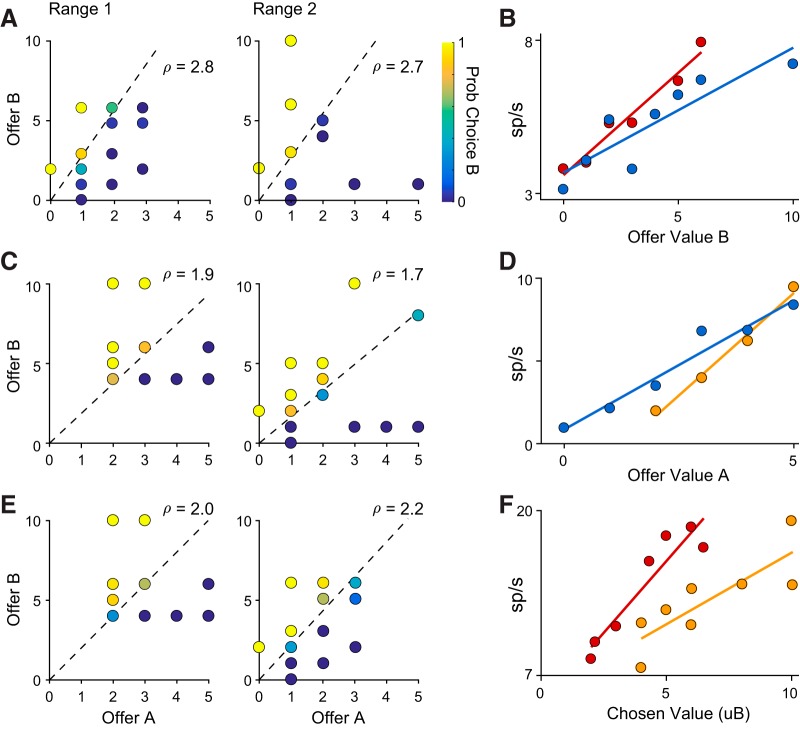
Figure 3.
Examples of behavior and neuronal activity for three types of range transition. A, B, Increase in maximum value (low → wide). C, D, Decrease in minimum value (high → wide). E, F, Decrease in both (high → low). A, C, E, Choice behavior. Each point represents one offer type. Quantity of offer A is shown on the x-axis and quantity of offer B on the y-axis. The color of each point indicates the fraction of trials in which the animal chose Juice B. Dashed lines show the indifference line calculated by logistic regression. B, D, F, Neural activity across the two blocks. Colors indicate range type (red, low range; yellow, high range; blue, wide range). Each panel shows data from a different neuron. B, Offer value B response, post-offer time window. D, Offer value A response, post-offer time window. F, Chosen value response, post-juice 2 time window.

