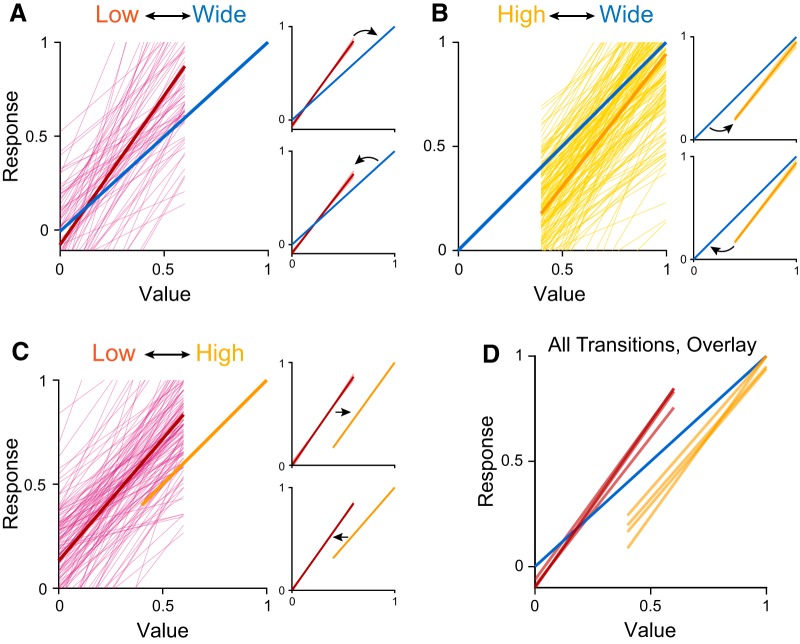
Figure 4.
Adaptation in offer value responses across each type of range transition. A–C, Individual responses (thin lines) and population mean (thick line) for (A) change in maximum value (n = 72); (B) change in minimum value (n = 163); and (C) change in both (n = 129). Insets, Average responses for transitions where Vmax and/or Vmin increase (top) or decrease (bottom). Shaded region in inset shows mean ± SEM. Responses are normalized to the wide range (A, B) or high range (C). Insets in C are normalized to Vmax(high) − Vmin(low). D, Overlay of mean responses for all six types of range transition. Transitions from A and B are aligned to wide range. Transitions from A and C are aligned to the low range. Responses from all analyzed time windows are shown.

