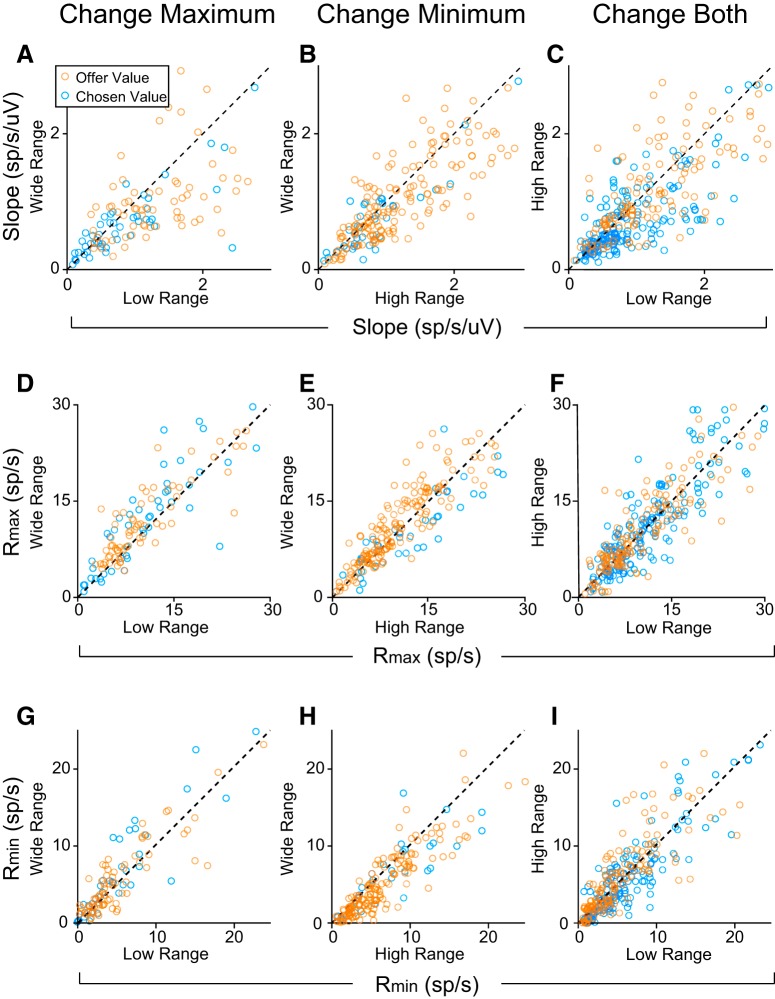
Figure 6.
Metrics of value adaptation for each type of block transition. Transition type: (A, D, G) maximum value changes (n = 121); (B, E, H) minimum value changes (n = 206); (C, F, I) both change (n = 317 responses). A–C, Changes in the slope of value encoding of offer value and chosen value responses. Dashed lines show y = x. Value encoding was generally steeper for low or high value ranges compared with the wide range (high vs wide: p = 5.6 × 10⁻⁹, W = 1.6 × 10⁴; low vs wide: p = 7.3 × 10⁻⁸, W = 5.8 × 10³). When both maximum and minimum values changed, the encoding slope for high and low value ranges was close to the unity line, but slightly higher for the low value range (p = 4.8 × 10⁻¹⁰, W = 3.5 × 10⁴). This effect was driven by chosen value responses. Offer value responses alone did not show such a difference (p = 0.23, W = 2.5 × 10³). D–I, Across-block comparisons of Rmax (D–F) and Rmin (G–I) for each type of range transition. Rmax (Rmin) was generally higher when Vmax (Vmin) was higher. D, Rmax,wide > Rmax,low (p = 6.7 × 10⁻⁶, W = 2.0 × 10³); 6 points fall outside the limits of the plot. E, Rmax is not significantly different between high and wide blocks (p = 0.058, W = 9.0 × 10³); 14 points fall outside the limits of the plot. F, Rmax is higher in the high range compared with the low (p = 5.4 × 10⁻⁴, W = 2.0 × 10⁴); 16 points outside the limits of the plot. G, Rmin,wide > Rmin,low (p = 0.026, W = 2.8 × 10³); 6 points fall outside the limits of the plot. H, Rmin,wide < Rmin,high (p = 6.2 × 10⁻⁹, W = 1.6 × 10⁴); 9 points fall outside the limits of the plot. I, Rmin,high > Rmin,low (p = 9.2 × 10⁻⁴, W = 2.0 × 10⁵); 8 points fall outside the limits of the plot. Dashed lines show y = x. All p values based on Wilcoxon signed rank test. Responses from all analyzed time windows are shown.

