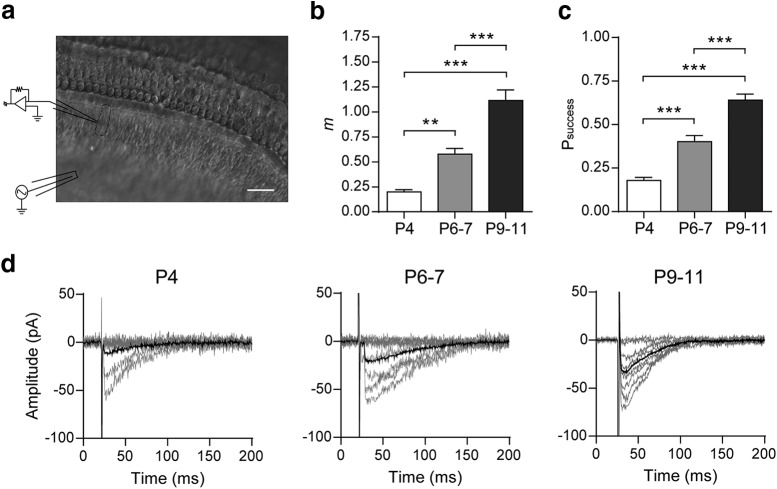
Figure 1.
Synaptic strength at the mouse MOC–IHC synapse increases during postnatal development. a, Micrograph of the mouse cochlear preparation used in the present study. IHCs were recorded with a patch pipette at a holding potential of −90 mV and MOC fibers were electrically stimulated using a monopolar electrode placed ∼80 μm modiolar to the base of the IHCs. Scale bar, 20 μm. b, Bar graph showing the progressive increase in m from P4 to P9–P11. c, Bar graph illustrating the increase in Psuccess during the same period shown in b. d, Representative individual (gray) and average (black) traces of eIPSCs recorded at P4, P6–P7, and P9–P11 IHCs. Average eIPSC amplitudes include failures of release. (See Materials and Methods for explanation of why we name these currents “inhibitory” although they are inward.) Data from P9–P11 are shown for comparison and were taken from Zorrilla de San Martín et al. (2010). Error bars indicate SEM. **p < 0.01, ***p < 0.001.

