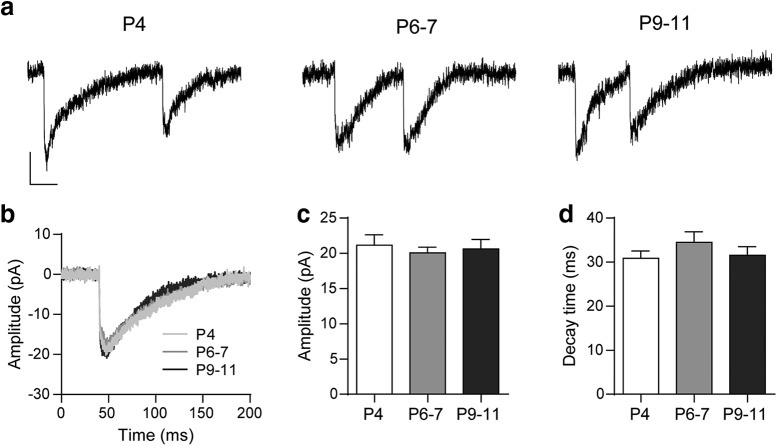
Figure 2.
Biophysical properties of sIPSCs at the MOC–IHC synapse during postnatal development. a, Representative traces of sIPSCs recorded at P4, P6–P7, and P9–P11 IHCs (holding potential: −90 mV). Vertical scale bar, 10 pA; horizontal scale bar, 50 ms. b, Representative average traces of sIPSCs recorded in one IHC from each developmental stage (sIPSCs, n: P4 = 23, P6–P7 = 18, P9–P11 = 27). c, d, Bar graphs illustrating that neither the sIPSC amplitude (c) nor the decay time constant (d) is modified during MOC–IHC synapse maturation. Error bars indicate SEM.

