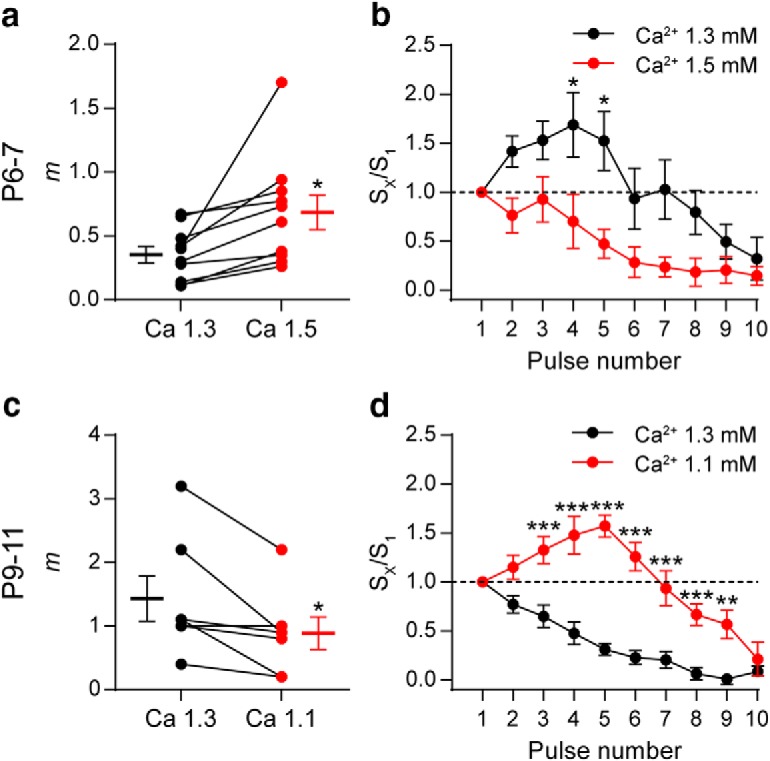
Figure 4.

Changes in the initial probability of release modify the STP pattern. a, Graph showing that, in P6–P7 IHCs, an increase in [Ca2+]o from 1.3 (black circles) to 1.5 mm (orange circles) significantly increased m. The mean ± SEM values of m measured in both [Ca2+]o are plotted to the left and right of their respective individual responses. b, Normalized amplitude of eIPSCs (Sx/S1) plotted against pulse number during 10-pulse stimulation trains at 100 Hz recorded in both [Ca2+]o conditions in P6–P7 IHCs. Note that the STP pattern changed from facilitation in [Ca2+]o = 1.3 mm to depression in [Ca2+]o = 1.5 mm. c, Graph illustrating the decrease in m at P9–P11 IHCs after changing [Ca2+]o from 1.3 to 1.1 mm. d, Normalized amplitude of eIPSCs (Sx/S1) plotted against pulse number during 10-pulse stimulations trains at 100 Hz recorded in both [Ca2+]o conditions in P9–P11 IHCs. In this case, the STP pattern changed from depression at [Ca2+]o = 1.3 mm to facilitation at [Ca2+]o = 1.1 mm. Error bars indicate SEM. *p < 0.05, **p < 0.01, ***p < 0.001.
