Figure 5.
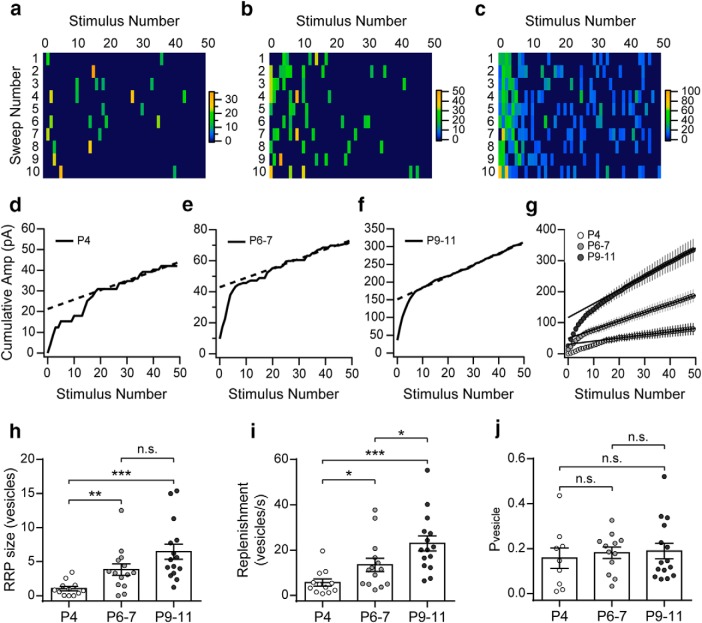
Size of the RRP and its replenishment rate increase during development. a–c, Color coded rectangles represent the amplitudes of the eIPSCs evoked by trains (50 pulses at 100 Hz, each panel shows 10 sweeps/columns) applied to P4, P6–P7, and P9–P11 IHCs. Color scale bars are expressed in pA. d–f, Representative examples of the average cumulative amplitude plots built to estimate the RRP and replenishment rate (continuous lines are the cumulative amplitudes and the dashed lines are the linear fits of the last 20 points of the plot). g, Cumulative plots built with the pooled data show the increase of the intercept at each of the developmental stages (P4: white; P6–P7: light gray; P9–P11: dark gray). h, Summary plot showing the increase in RRP size during development. i, Summary plot showing the increase in synaptic vesicles replenishment rate during high-frequency stimulation at the same time period. j, Summary plot illustrating that Pvesicle remains constant throughout the developmental stages analyzed. Error bars indicate SEM. *p < 0.05, **p < 0.01, ***p < 0.001.

