Figure 6.
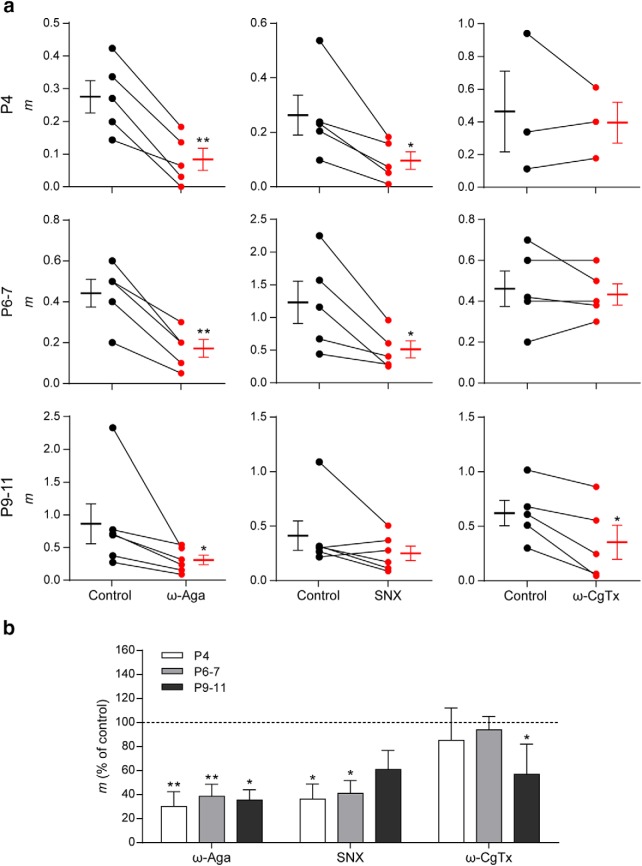
Different types of VGCCs support ACh release at the MOC–IHC synapse during postnatal development. a, Graph showing the effect on m of 200 nm ω-Aga IVA, 500 nm SNX, and 500 nm ω-CgTx, P/Q-, R-, and N-type VGCC-specific antagonists, respectively, in P4, P6–P7, and P9–P11 cochlear preparations (control: black circles, treated: red circles). The mean ± SEM values of m measured before and after toxin treatment are plotted to the left and right of their respective individual responses. d, Bar graph summarizing the effect on m of 200 nm ω-Aga, 500 nm SNX, and 500 nm ω-CgTx at the different stages of development. Note that R-type VGCCs contribute to the release process only during early stages of development (P4 and P6–P7), whereas N-type VGCCs begin to support ACh release at a later period (P9–P11) (ω-Aga m percentage of control: P4 = 30.17 ± 12.30, P6–P7 = 38.64 ± 9.91, P9–P11 = 35.47 ± 8.60; SNX m percentage of control: P4 = 36.32 ± 12.47, P6–P7 = 41.04 ± 10.68, P9–P11 = 60.88 ± 15.89; ω-CgTx m percentage of control: P4 = 85.32 ± 26.92; P6–P7 = 93.97 ± 11.19; P9–P11 = 56.92 ± 25.14). Data from P9–P11 mice are shown for comparison and were taken from Zorrilla de San Martín et al. (2010). Error bars indicate SEM. *p < 0.05, **p < 0.01.

