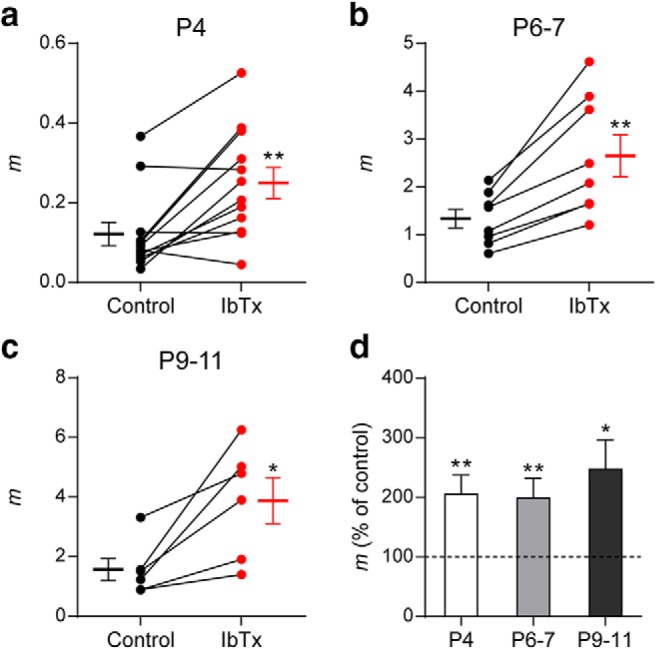
Figure 8.

BK channels negatively modulate ACh release at the MOC–IHC synapse throughout development. a–c, Graphs showing the effect on m of 100 nm IbTx, an antagonist of BK channels, in P4 (a), P6–P7 (b), and P9–P11 (c) cochlear preparations (control: black circles, treated: red circles). The mean ± SEM values of m measured before and after toxin treatment are plotted to the left and right of their respective individual responses. d, Bar graph summarizing the effect on m of 100 nm IbTx at the different stages of development evaluated (IbTx m percentage of control: P4 = 204.92 ± 32.22; P6–P7 = 198.55 ± 32.92; P9–P11 = 247.03 ± 49.03). Data from P9–P11 mice are shown for comparison and were taken from Zorrilla de San Martín et al. (2010). Error bars indicate SEM. *p < 0.05, **p < 0.01.
