Figure 1.
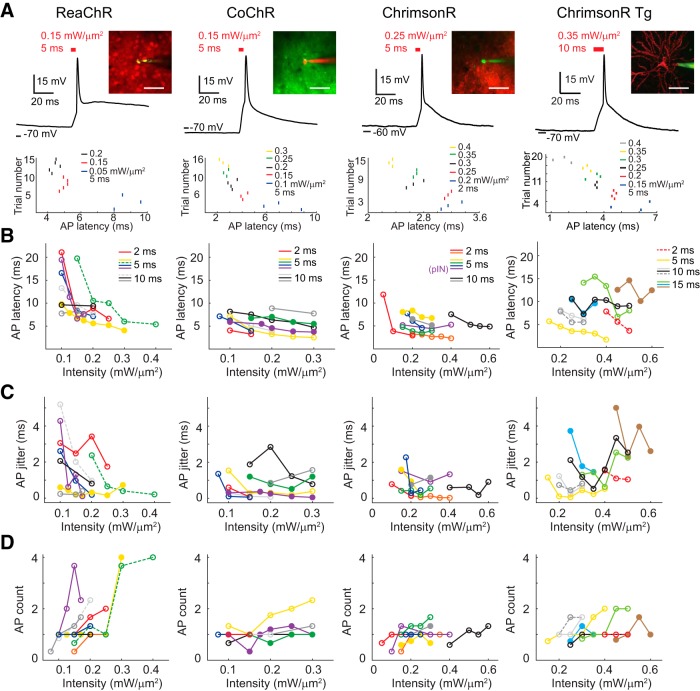
Precise 2P holographic activation of single cell in vivo. A, Top, Example traces of AP induction at the L2/3 of anesthetized mouse visual cortex upon brief pulse of holographic illumination in opsin-positive cells via viral expression of ReaChR, CoChR, and ChrimsonR and transgenic expression of ChrimsonR (ChrimsonR Tg) in mouse line Cux2-CreERT2;Ai167. Insets are 2P images of a target cell recorded via a glass pipette filled with AlexaFluor-488 (green) or AlexaFluor-592 (red). Bottom, Example raster plots of spike timing for each cell in response to different excitation intensities. Scale bar, 47 μm. B, AP peak latency in example individual cells (connected dots represent data from the same cell) in relation to the excitation intensity upon illumination of 2, 5, or 10 ms (n = 7, 8, 8, 7 for ReaChR, CoChR, ChrimsonR, and ChrimsonR Tg). For ReaChR and ChrimsonR Tg, data in dashed lines are from the same cell. Solid circles indicate whole-cell recordings. Open circles indicate cell-attached recordings. For ChrimsonR, three recordings were obtained from putative fast-spiking interneurons. C, Jitter of AP peak latencies as a function of illumination intensities from the same cells as in B. D, Spike count as a function of excitation intensity from the same cells as in B and C. For each opsin, AP properties from the same cell are indicated as the same color. Solid and dashed lines of the same color represent recordings under different illumination duration from the same cell.

