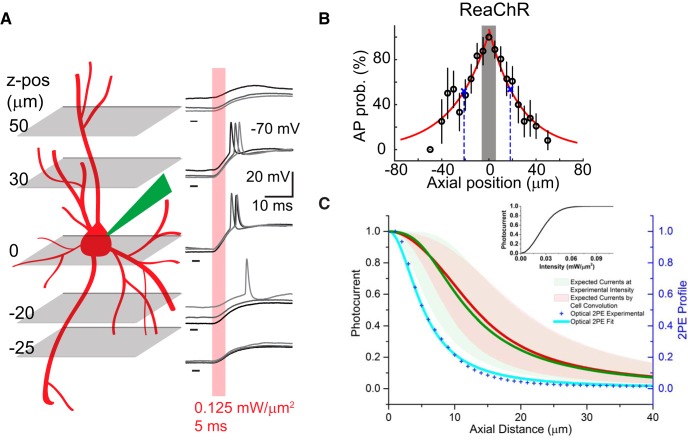
Figure 5.
Axial selectivity of holographic activation in vivo. A, Left, Schematic of the mapping of the axial resolution of holographic optogenetic activation in an opsin-positive cell by sequentially placing the excitation spot at different axial planes after manual defocusing. Right, Example whole-cell recordings of a ReaChR-expressing cell in response to 5-ms patterned illumination of 0.125 mW/μm2 at the corresponding axial positions. B, Axial resolution of AP generation in response to photostimulation through a circular holographic spot with a diameter of 12 μm at the threshold excitation intensity in neurons (n = 12) expressing ReaChR at L2/3 mouse visual cortex. Note the larger variability in AP generation when the excitation pattern is delivered deeper away from the focal plane. Shaded gray area indicates the assumed axial span of target soma. C, Estimated photocurrent distribution along the axial direction when illuminating at the intensity used for axial resolution experiments (I = 0.06 + 0.04 mW/μm2; mean ± SD) for ReaChR (green line). Expected photocurrent axial distribution after convolving the estimated distribution of photocurrents with a 12-μm-diameter step function, matching the assumed cell size (red line). Red and green shaded areas delimit the corresponding SD ranges, showing how the effective working excitation intensity can significantly affect the axial resolution. Inset, Photocurrent-versus-illumination intensity for ReaChR (adapted from Chaigneau et al., 2016). The 2P excitation (2PE) axial intensity profile of the illumination beam is also shown (blue line).

