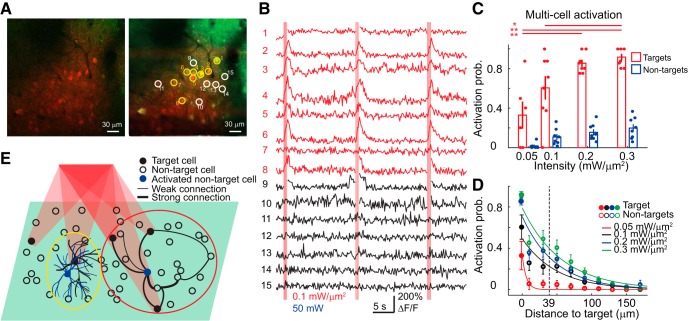
Figure 8.
Holographic activation of multiple cells. A, An example multitarget experiment. Top left, A high-resolution 2P image of both red (ReaChR) and green (GCaMP6s) channels. Top right, Multiple target (yellow circles) and neighboring nontarget cells (white circles) on an average intensity profile. B, Plots of the calcium signal from the corresponding target (red traces) and nontarget (black traces) cells. Vertical red bars indicate photostimulation epochs. Red indicates excitation intensity. Blue indicates 2P scanning power. C, Activation probability of targets and nontargets as a function of excitation intensity in multicell activation experiments (8 FOVs). Each filled circle in red or blue indicates the mean activation probability of multiple targets or nontargets in one FOV. Asterisks denote significant difference in activation probability between excitation intensity (p < 0.0001 for target cells' activation probability between 0.05 and 0.2 mW/μm2, 0.05 and 0.3 mW/μm2, p = 0.12 and p = 0.021 between 0.1 and 0.2 mW/μm2, 0.1 and 0.3 mW/μm2; multiple comparisons after ANOVA). D, Activation probability based on calcium signal of target neurons (solid circles at distance 0) and nontarget (empty circles) as a function of distance from the target cell (8 FOVs). Dashed lines indicate the distance at which nontarget neurons displayed an activation probably that was ∼50% of that of target neurons at an excitation intensity of 0.3 mW/μm2. The distances between nontarget cells and target cells are distributed in 20 μm bins. E, Schematic illustration of out-of-target activation. Black filled circles indicate the target cells in a single cortical plane (green shade) activated by holographic stimulation. Empty circles indicate the nontarget cells located on the same plane. Black lines of varying thickness between neurons denote differences in connection strength. Two blue nontarget cells represent two cases that cause out-of-target activation. One nontarget cell (the blue cell in the yellow circle on the left) is activated because its neurites cross the excitation volume targeting the neighboring cell. The other nontarget cell (the blue cell in the red circle at the right) is activated because of its connections to other activated target cells.

