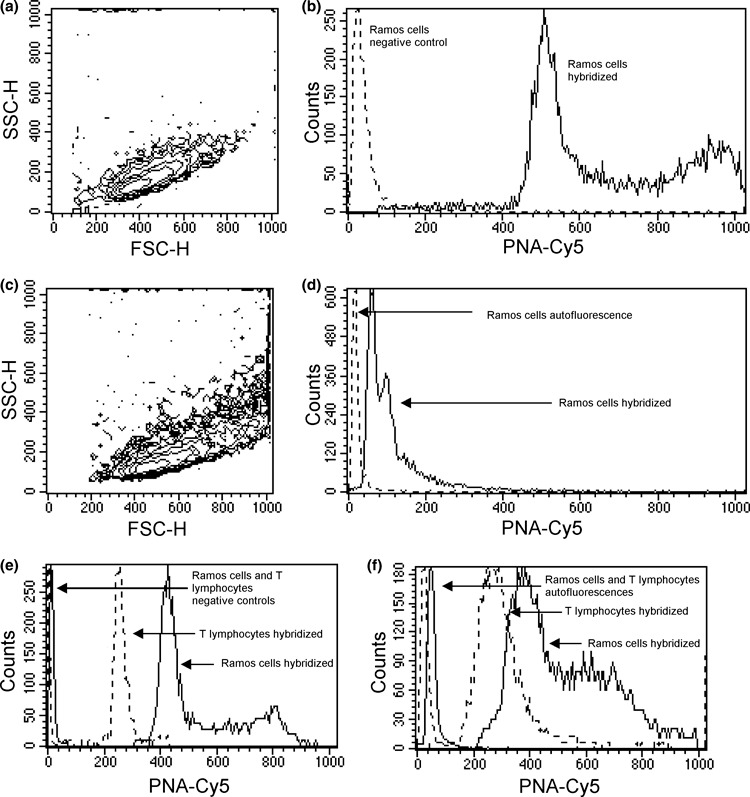
Figure 2.

Comparison between typical results obtained with our and the original flow FISH procedure. FSC‐H versus SSC‐H contour graphs (a, c) show the better preservation of physical parameters of Ramos cells after our (a) and original flow FISH (c) treatment. Overlaid histograms (b, d) show the better PNA‐Cy5 staining efficiency obtained with our (b) and original flow FISH (d) procedure. Continuous lines correspond to hybridized samples, dashed lines correspond to our negative control (b) and original autofluorescence (d). Both samples were acquired using the same instrument setting. Overlaid histograms (e, f) show the better PNA‐Cy5 staining efficiency obtained with our (e) and original flow FISH (f) procedure on mixed samples of human T lymphocytes and Ramos cells. Continuous lines correspond to hybridized Ramos cells and their control, dashed lines correspond to hybridized lymphocytes and their control. With our procedure (e) the FL4‐H PMT voltage was 660, and with original flow FISH (f) the FL4‐H PMT voltage was 950.
