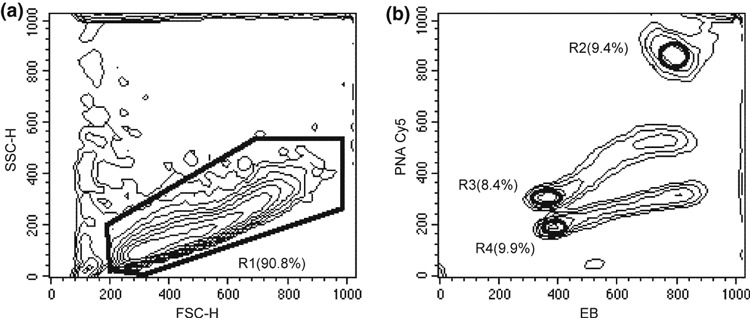
Figure 5.

Hybridization proportionality. FSC‐H versus SSC‐H (a) and EB versus PNA‐Cy5 (b) contour graphs of 1301, Ramos and Daudi mixed cell lines. R1 gated EB and Cy5 fluorescences were acquired focusing events to gate G1 + G0 cells of 1301 (R2), Ramos (R3) and Daudi (R4) for measuring EB and Cy5 MFIs and calculating RTLs. In brackets, subset percentages are reported.
