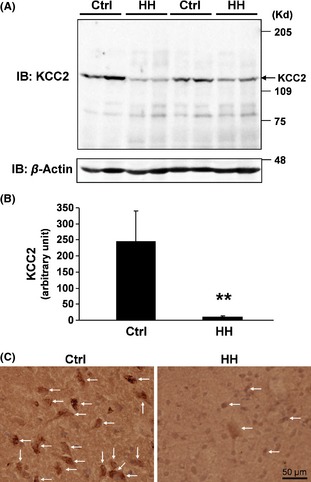
Figure 5.

Downregulation of KCC2 in HH. (A and B) Proteins extracted from HH and control tissue specimens were analyzed by immunoblotting with anti‐KCC2 and anti‐β‐actin, respectively (A). Densitometric analysis results of immunoblotting data of anti‐KCC2 from 14 HH and eight controls are shown (B). **P < 0.01. (C) Immunostaining with an anti‐KCC2 antibody in tissue sections (arrows) indicates downregulated KCC2 expression in HH versus control tissue. Bar, 50 μm.
