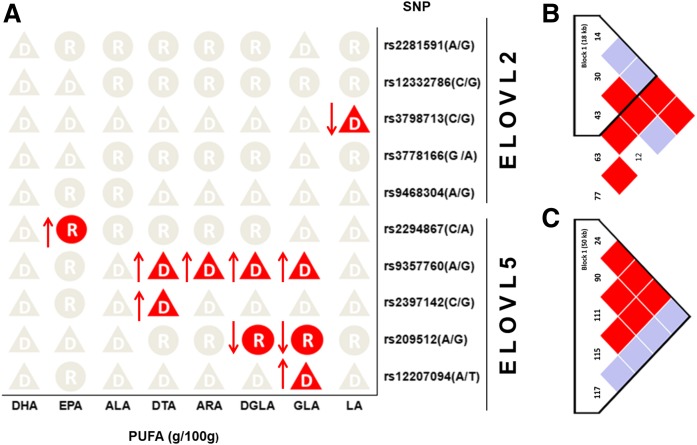
Fig. 1.
Breast-milk PUFA levels in optimal genotype model (A) and linkage-disequilibrium block plots of SNPs in ELOVL2 (B) and ELOVL5 (C). The letter “D” in the triangle represents the dominant model (PUFA changes of Mm + mm compared with MM); the letter “R” in the circle represents the recessive model (PUFA changes of mm compared with MM + Mm). MM, major allele homozygote; mm, minor allele homozygote; Mm, heterozygote.

