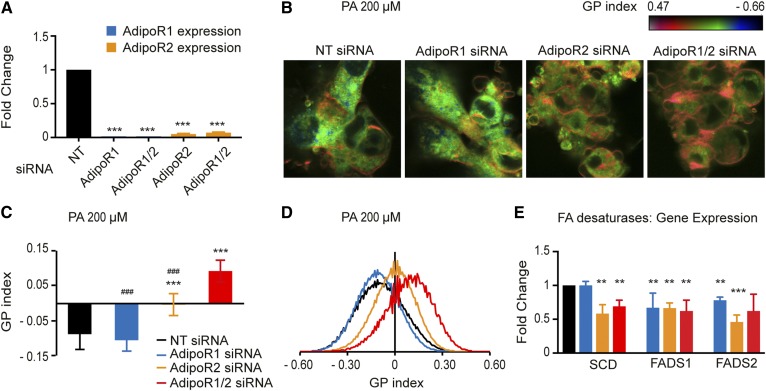
Fig. 5.
The AdipoRs maintain membrane fluidity and desaturase expression in primary human cells (HUVECs). A: qPCR results showing the efficiency of the knockdown in HUVECs using NT, AdipoR1, and/or AdipoR2 siRNA. The expression levels are normalized to the NT value. B: Pseudocolor images showing the Laurdan dye GP index at each pixel position in HUVECs challenged with 200 μM PA and treated with NT, AdipoR1, and/or AdipoR2 siRNA. Note the pronounced rigidification of the plasma membrane in the AdipoR1/2 siRNA-treated cells. C: Average GP index from several images as in panel A (n = 10–15). D: Distribution of the GP index values in representative images for each treatment. E: qPCR results showing the expression of three desaturases in HEK293 cells following knockdown using NT, AdipoR1, and/or AdipoR2 siRNA. The expression levels are normalized to the NT value. Error bars show the SDs. **P < 0.01 and ***P < 0.001 compared with the control treatment. ###P < 0.001 compared with the AdipoR1/2 siRNA treatment. GP, generalized polarization; NT, nontarget.

