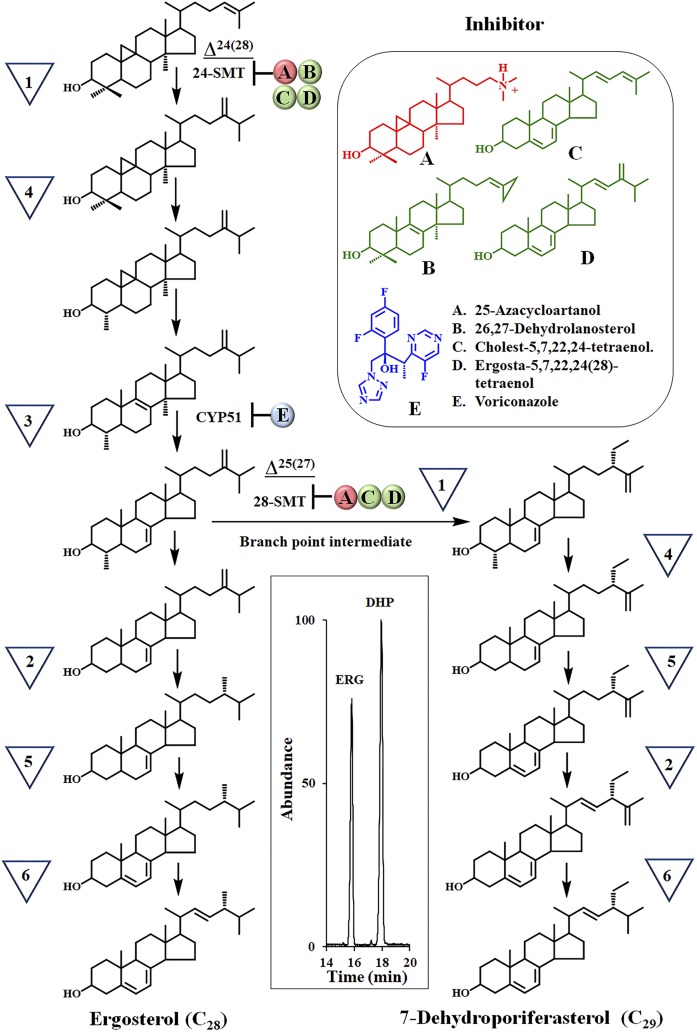
Fig. 2.
A. castellanii sterol biosynthesis pathway. The inverted triangles represent biosynthetic steps as defined in Fig. 1. Inhibitors were tested against Ac cell growth and isolated enzymes, SMT and CYP51, as reported in (16, 17) and results of studies herein. The inset is a GC profile of total sterols isolated from 4 day growth-arrested trophozoites. ERG, ergosterol; DHP, 7-dehydroporiferasterol.

