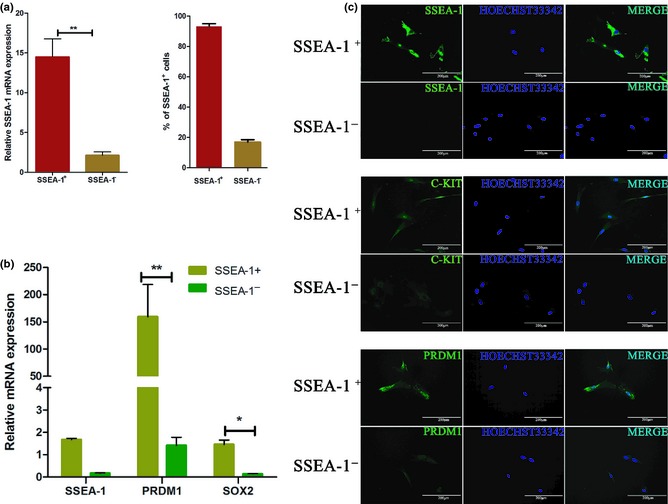
Figure 3.

Examination of SSEA‐1 + and SSEA‐1 − cells after MACS. (a) Analysis of sorting efficiency by immunofluorescence staining and qRT‐PCR of SSEA‐1+ cell percentage and SSEA‐1 expression level respectively. (b) qRT‐PCR analysis of sorted SSEA‐1+ and SSEA‐1− cells. Expression levels of PRDM1, SSEA‐1 and SOX2 in SSEA‐1+ cells were significantly higher than those of SSEA‐1− cells. (c) Immunofluorescence staining of expression levels of SSEA‐1, PRDM1 and C‐KIT in sorted SSEA‐1+ and SSEA‐1− cells.
