Figure 4.

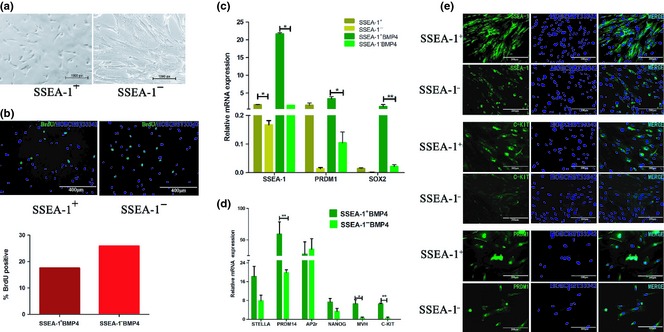
SSEA‐1 + hUC ‐MSCs differentiated into PGC‐like cells under induction of BMP4. (a) Morphological changes of sorted SSEA‐1+ and SSEA‐1− hUC‐MSCs. Under the induction medium, SSEA‐1+ cells visibly shrank, but SSEA‐1− cells had invariant sizes. (b) Proliferation levels of BMP4 induced cells were determined by BrdU immunofluorescence staining. SSEA‐1+ cells had higher proliferation level compared to SSEA‐1− cells. (c) qRT‐PCR analysis of PRDM1, SSEA‐1 and SOX2 expression levels in SSEA‐1+ and SSEA‐1− hUC‐MSCs induced by BMP4. Expression levels of these were increased in both groups, but this trend was more evident in the SSEA‐1+ group. (d) qRT‐ PCR analysis demonstrated that STELLA, PRDM14, NANOG, VASA and C‐KIT expression levels had a similar trend with SSEA‐1 expression, but AP2γ maintained a relatively stable level in both groups. (e) Immunofluorescence staining of SSEA‐1, C‐KIT and PRDM1 in BMP4‐induced SSEA‐1+ and SSEA‐1− hUC‐MSCs.
