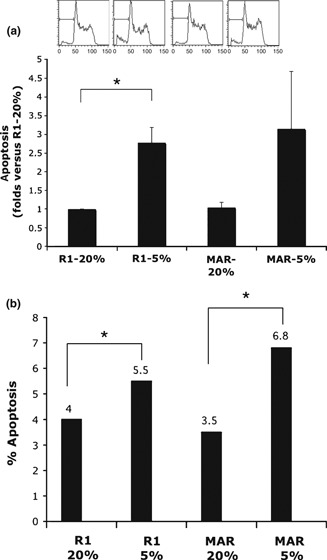
Figure 1.

Apoptosis measurements from R1 and MAR ES cells grown on feeder layers. (a) Apoptosis measurements from R1 and MAR ES cells on feeder layer by cell cycle analysis. The sub‐G1 peak in DNA histograms was higher under hypoxic conditions, indicating higher numbers of apoptotic cells. Mean ± SE of two independent experiments is shown. *P < 0.05, Student’s t‐test. (b) Apoptosis measurements from R1 and MAR ES cells by TUNEL labelling. Mean values of two experiments are shown. After 3 days culture in different conditions, level of apoptotic cells for R1 and MAR was significantly higher under hypoxic conditions than under normoxic conditions (P < 0.05).
