
Figure 2.
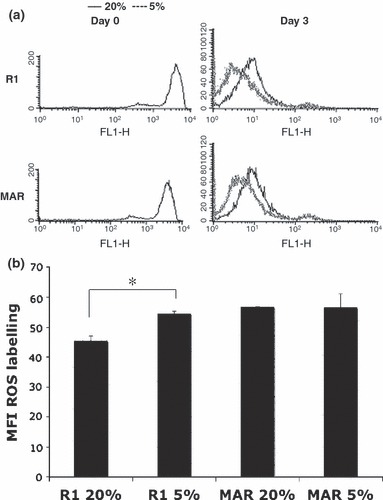
Proliferation and ROS measurements in mES cell cultures at different oxygen tensions. (a) Mouse R1 and MAR ES cells were labelled with CFSE. Profiles shown in the left panels correspond to labelled populations at day 0 (day of labelling). Right panel shows fluorescence profile of cells recovered 3 days later. Fluorescence intensity of cells decreased 2‐fold at each cell division. Under hypoxic conditions, proliferation of both types of mES cell was greater than under normoxic conditions. Culture of R1 and MAR ES cells on feeder layers and at 5% oxygen stimulated cells in this experiment to complete an extra cell cycle. (b) Mouse R1 and MAR ES cells were labelled with intracellular ROS probe CM‐H2DCFDA after 3 days culture under different oxygen tensions. Chart depicts the mean fluorescence intensity in two independent experiments. *P < 0.05 in Student’s t‐test.