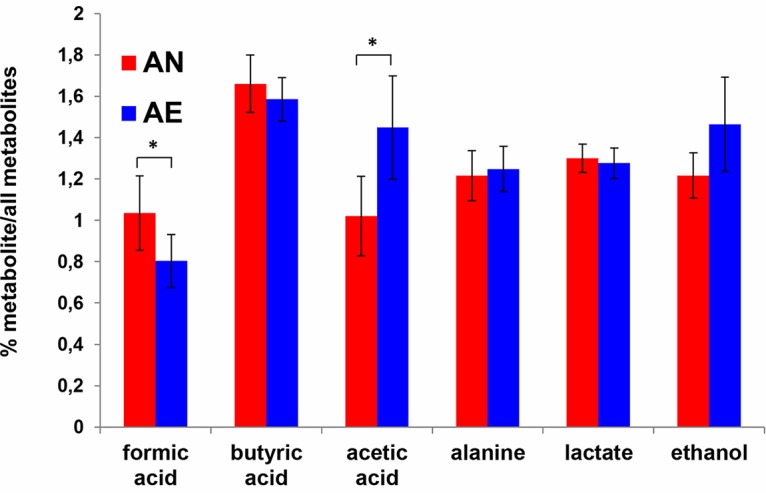
FIG 6.

Extracellular metabolite concentrations from pooled ISS strains (n = 6). Relative concentrations (%) of the individual metabolites versus all extracellular metabolites investigated are shown on the y axis. *, P < 0.05 according to Student’s t test.
