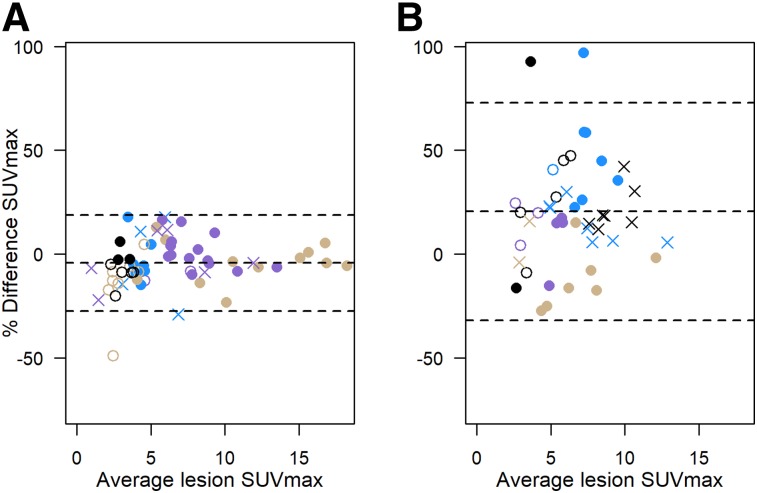
FIGURE 3.
Percentage difference in SUVmax vs. average SUVmax: 12 patients (85 lesions) with repeat scans using same scanner or different scanners from same unit (combined data from Figs. 1A and 1B) (A); 11 patients (77 lesions) using different scanners from different sites (B). Plotting character/color identifies multiple lesions in single patient, as for Figure 1. Dashed lines = average percentage difference and 95% limits of agreement.

