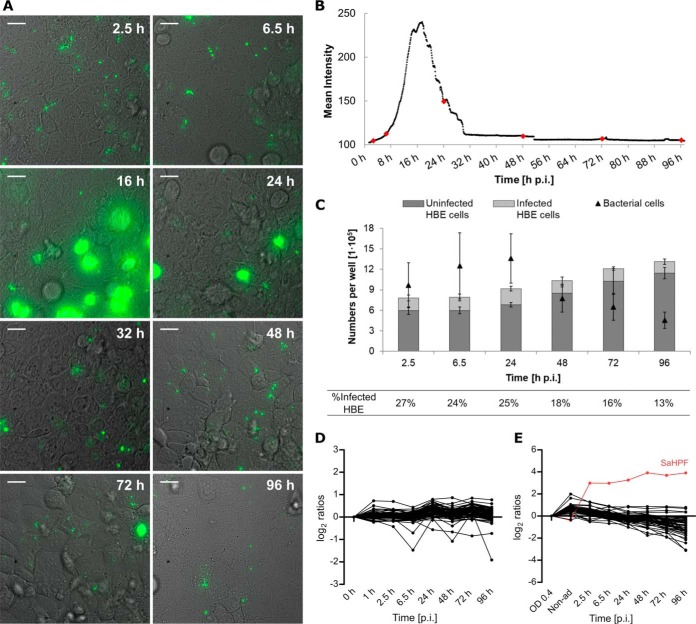
Fig. 1.
After internalization two subpopulations of S. aureus can be distinguished by differences in replication rate. The progression of the infection was followed by time-lapse microscopy (A; Supplemental videos; scale bar = 20 μm) and the GFP fluorescence intensity was quantified to elucidate the dynamics of the bacterial population (B). Most of the bacteria replicate intracellularly during the first day of infection, but a secondary subpopulation remains in a dormant state during the whole time of observation. The red dots indicate the time points of sample collection for further experiments. Counting of bacterial cells, and infected and uninfected host cells, as jointly presented in (C) confirmed the changes in both populations. Average values of four replicates are presented (B-C). Mass spectrometry quantification of ribosomal proteins of the host (D) or S. aureus (E). The list of proteins presented in the line plots is available in supplemental Table S8. The levels of the proteins were calculated based on the mid-exponential phase or the 0 h time point as reference, for the bacteria and the host, respectively. The SaHPF protein detected in higher amounts is colored in red.

