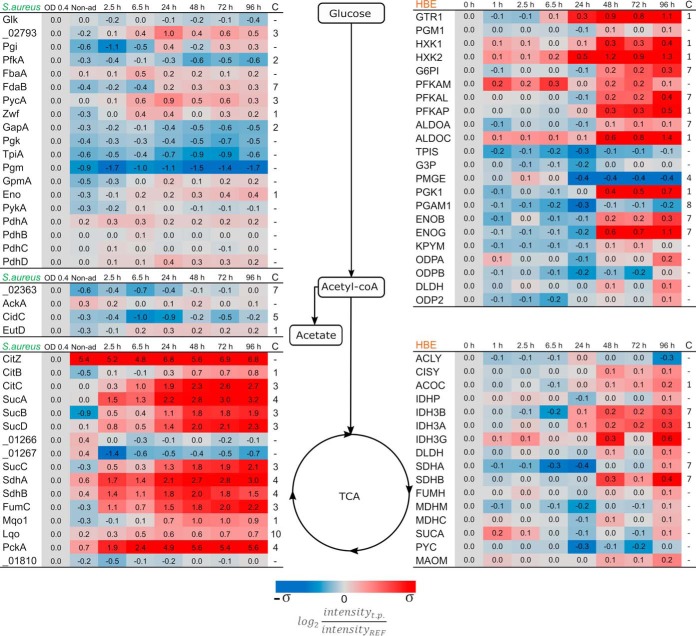
Fig. 2.
Quantification of proteins related to the central carbon metabolism. Proteins were grouped depending on their main function in the different pathways, and boxes mark selected central metabolites. The proteome data from S. aureus are depicted on the left side of the diagram and the proteins without assigned gene symbol are labeled according to their locus tag without the “SAOUHSC_” identifier. The host data are shown on the right side of the diagram. Protein trends that deviate (p value <0.01) from constant linearity over time were fitted to clusters according to their behavior (supplemental Fig. S2). Clustering assignment is shown in the last column “C.” The color coding is based on the standard deviation of each set of data. σS. aureus = 2.34 and σHBE = 0.33. The ratios were obtained from the measurements of four biological replicates.

