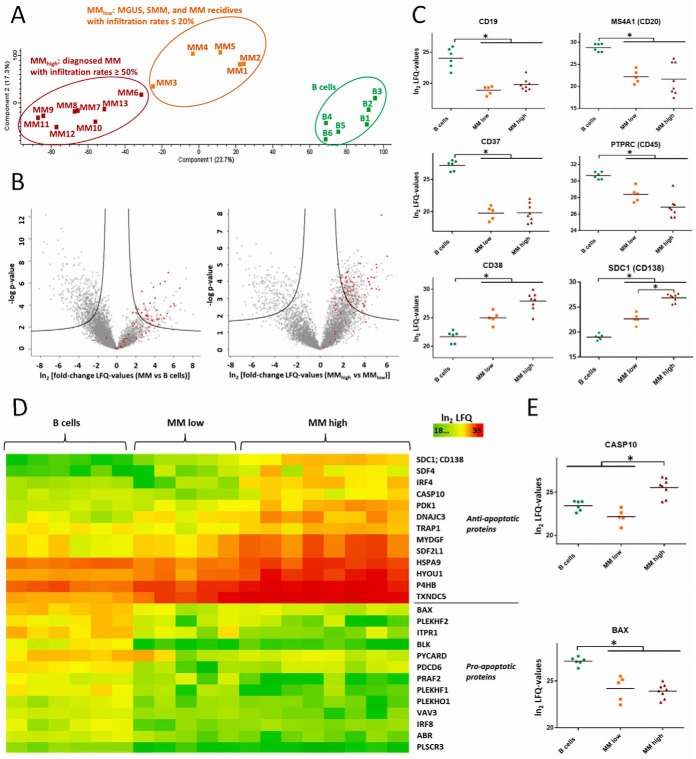
Fig. 1.
Proteome profiling of primary human MM cells and comparison to B cells. The Perseus software (30, 33) was used to perform statistical data analyses. A, PCA based on label-free quantification (LFQ) of 6038 cytoplasmic proteins detected in B cells and MM cells, showing three groups: B cells; MMlow cells from patients with MGUS or SMM, as well as from patients with MM with BM infiltration rates with MM cells ≤ 20%; and MMhigh cells from patients with diagnosed MM and BM infiltration rates ≥ 40%. B, Volcano plots comparing the abundance levels of the same proteins in MM versus B cells (left panel) and in MMhigh versus MMlow cells (right panel). Proteins, which were found significantly up- or downregulated, are delineated in each plot in the right and in the left area above the black curves, respectively. Proteins involved in translational processes, according to GO terms, are highlighted in red. C, Levels of typical markers for B cell differentiation and/or for MM cells. D, Heat maps representing LFQ values of proteins involved in pro- or anti-apoptotic processes. E, Levels of two proteins involved in apoptosis. Significant regulations are indicated by asterisks.

