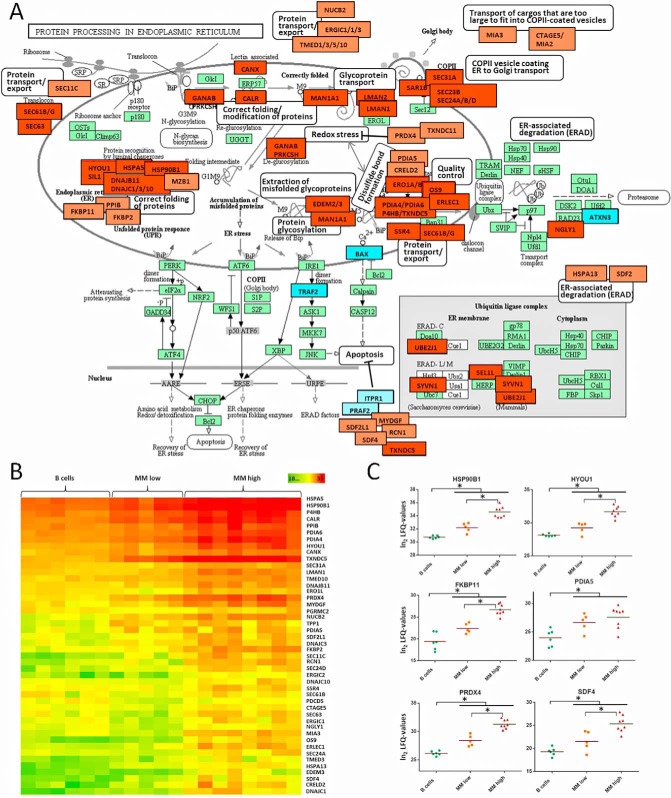
Fig. 2.
Protein processing in the in endoplasmic reticulum (ER) of MM cells. A, Based on the KEGG database for pathway analysis, proteins significantly upregulated in MM cells and related to ER activities were highlighted in red, downregulated proteins in blue. Lighter colors were used when proteins were associated to ER activities based on other references such as the UniProt database (40). Reproduction of the KEGG pathway map image “Protein processing in endoplasmic reticulum” (hsa04141) (127) with permission of Kanehisa Laboratories. B, Heat maps representing LFQ values of ER related proteins, demonstrating a progressive upregulation from B cells to MMlow and moreover to MMhigh cells. C, For selected proteins, corresponding LFQ values are represented as dot plots. Significant regulations are indicated by asterisks.

