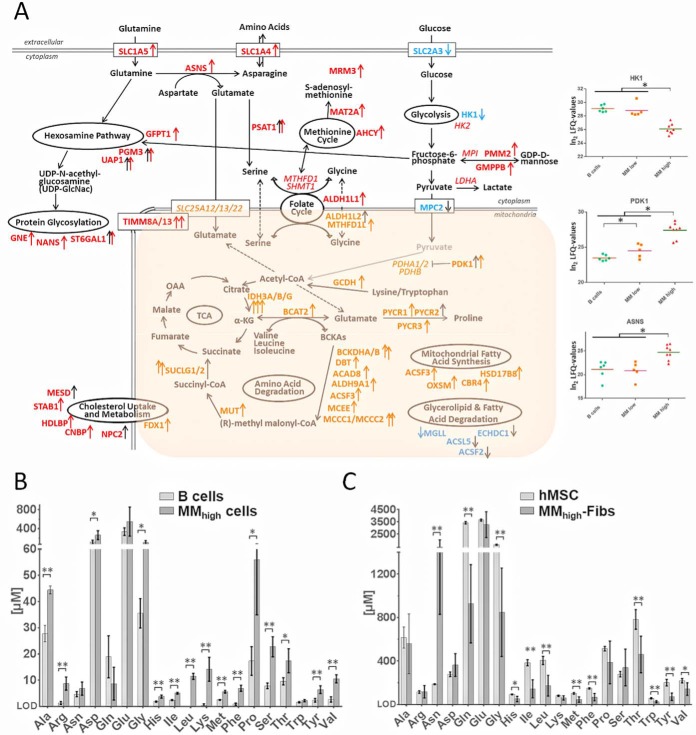
Fig. 4.
Regulation of proteins related to metabolic processes taking place in MM cells and results of metabolomics experiments. A, Metabolic pathways for which enzymes were found significantly up- or downregulated in MM versus B cells (black arrows) and in MMhigh versus MMlow cells (red and orange arrows for proteins upregulated in the cytoplasm and in mitochondria, respectively, blue arrows for downregulated proteins). Some proteins found at high levels but not regulated are indicated in italics. For three selected proteins, determined LFQ values are represented as dot plots. B, Levels of amino acids in B and MMhigh cells. C, Levels of amino acids in MM-associated BM fibroblasts (MM-Fibs) and in mesenchymal cells of the BM (hMSC) that were used as reference system. Significant regulations are indicated by asterisks. For metabolomics experiments: ** p-values < 0.01; * p-values < 0.05.

