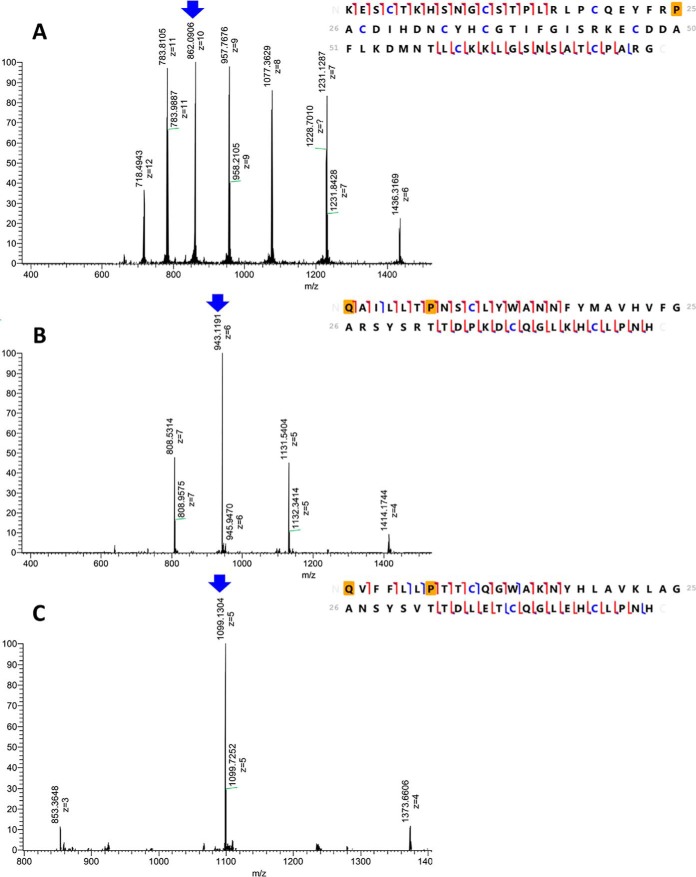
Fig. 6.
Top-down proteomics of the reduced and alkylated α1, α1 and β2-subunits of Cdpi-P. On the left side of the figure are the ESI-MS spectra of different charge distributions for each subunit. MS/MS by EThcD for these subunits were obtained for the peaks labeled with the blue arrow. Fragmentation maps, scoring and residue coverage were obtained using the software ProSight Lite (90). On the right side of the figure are the fragmentation maps for each subunit. The orange square represents the corresponded posttranslational modifications such as pyroglutamic acid and hydroxyproline. Carbamidomethylated cysteines are highlighted in blue. Red brackets are matched with c/z ions, whereas blue brackets are matched with b/y ions. The matching fragment list are shown in supplemental Fig. S5) A, ESI-MS spectra and fragmentation map of [M+10H]10+ = 862.1 corresponding to the α1-subunit in fraction II (42% sequence coverage). B, ESI-MS spectra and fragmentation map of [M+6H]6+ = 943.1 corresponding to the β1-subunit in fraction II (68% sequence coverage). C, ESI-MS spectra and fragmentation map of [M+5H]5+ = 1099.1 corresponding to the β2-subunit in fraction VI (64% sequence coverage).

