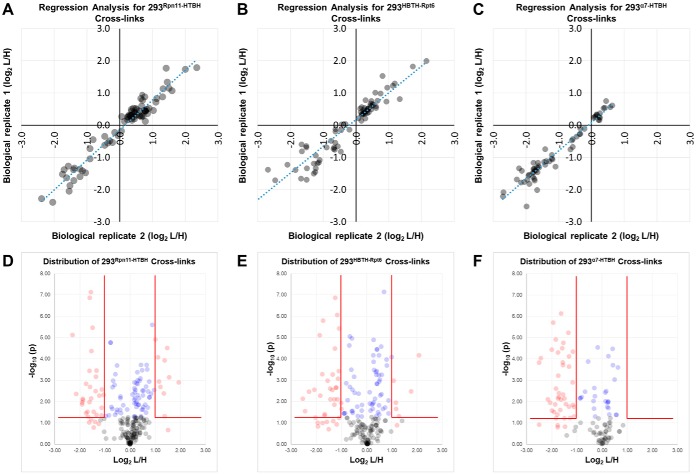
Fig. 3.
Assessment of reproducibility and distribution of quantified 26S cross-links. Following p value filtering, reproducibility of quantitation in separate biological replicates was determined for (A) 293Rpn11-HTBH, (B) 293HBTH-Rpt6, and (C) α7-HTBH. D–F, Volcano plots depicting the distribution of changed (red) and unchanged (blue) cross-links in proteasome purifications from each tagged cell line. Cross-links that did not meet the p value threshold of 0.05 are shown in gray.

