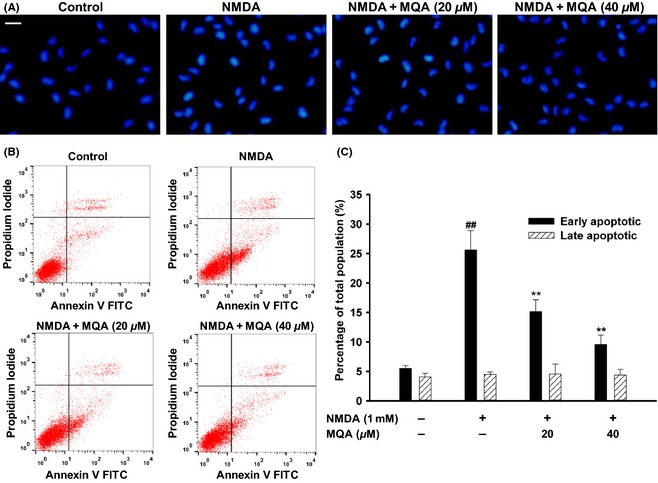
Figure 2.

Effects of MQA on NMDA‐induced apoptosis in SH‐SY5Y cells. (A) Representative fluorescence images were obtained after Hoechst 33342 staining. Scale bar: 20 μm. (B) Effects of MQA on NMDA‐induced early and late apoptosis after AV‐PI double staining. (C) The quantitative analysis of early and late apoptotic cells. ## P < 0.01 versus the control group. **P < 0.01 versus the NMDA‐treated group.
