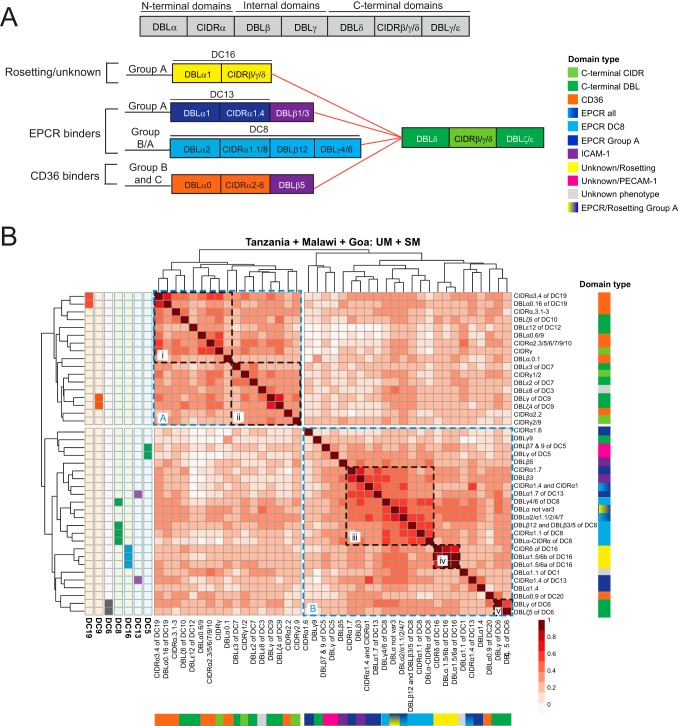
FIG 1.
Correlation of var domain transcript profiles across the three study sites. (A) Schematic of PfEMP1 domain architecture illustrating the relationship between known binding phenotypes and different var groups. CIDRβ/γ/δ domains (yellow) have unknown binding properties, CIDRα1 domains (light and dark blue) bind EPCR, CIDRα2-6 domains (orange) bind CD36, and DBLβ1/3/5 domains (purple) bind ICAM-1. (B) Transcriptional profiling of var genes was performed with 41 different primer sets targeting different var domain subtypes. Shown is a heat map of correlations (Spearman’s rho) of transcript levels of different var domain subtypes across all samples (SM and UM) from all three sites. Domain transcript levels were hierarchically clustered, and known tandem domain arrangements (e.g., DC19) are indicated to the left of the heat map. The right and bottom legends use the color scheme described in Table S2 to indicate EPCR/CD36/ICAM-1/Rosetting/PECAM-1/unknown/C-terminal domains. Clusters A and B and subclusters i to v are highlighted in dashed boxes.

