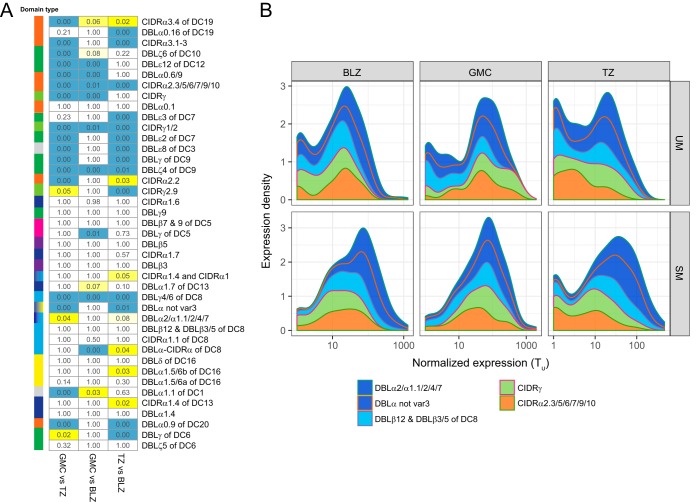
FIG 2.
Correlations in var transcript levels across the three study sites. (A) Kolmogorov-Smirnov P values comparing var domain subtype distributions between each pair of sites. P values under 0.01 are highlighted in blue, and those under 0.05 are highlighted in yellow. Subtype color annotations and order are identical to those in Fig. 1B. (B) Transcription levels of the top five transcribed var domain subtype transcripts (median Tu, >10) are stratified by site and severity (SM/UM).

