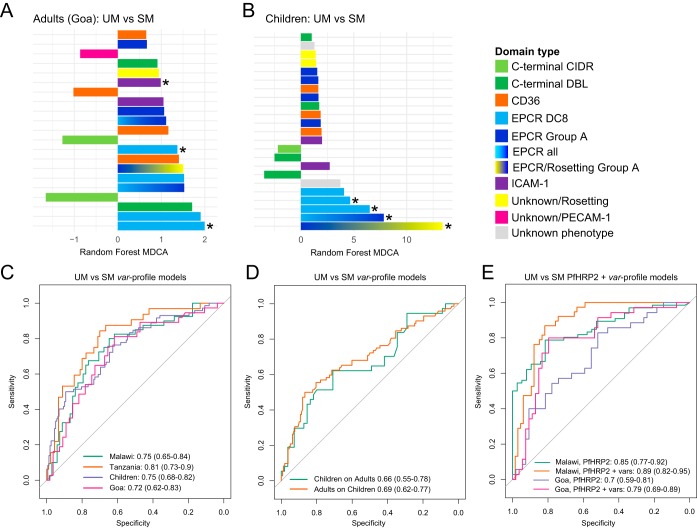
FIG 3.
Parasite load and var adhesion types independently predict severe malaria in adults and children. (A and B) Bar plots showing var domain subtype model importance (measured as MDCA) for child and adult UM versus SM models. Each bar represents a single domain subtype targeted by one of the 41 primer sets used to generate the RF model, colored by predicted binding phenotype or position in the protein (see also Table S2 and Table S3). Positive MDCA indicates higher expression of a specific domain subtype in SM and vice versa. Bars with asterisks indicate that these domain subtypes showed significant differences in expression (false-discovery rate [FDR] of ≤0.2) using the mProbes algorithm. (C) ROC curves showing out-of-bag predictions of RF models classifying samples as SM or UM. One model was trained per site, along with a total childhood model combining Malawi and Tanzania. Performance is shown as area under the ROC curve, with 95% confidence intervals in parentheses. (D) ROC curves showing blind predictive performance of the child model predicting adult severe malaria, and the adult model predicting child severe malaria. (E) ROC curves showing predictive performance of serum PfHRP2 levels alone to classify severe malaria and PfHRP2 combined with the var profile RF models.

